A data analytics partner for FIs focused on growth

Helping you grow your bank or credit union with a data analytics program that’s both usable and profitable.

The partner credit unions and community banks trust to reach their objectives.

“Gemineye proves to be an invaluable partner, wholeheartedly dedicated to aiding us in realizing our data analytics objectives.”

–  Clint Johnson, VP of Data & Analytics at P1FCU

“Gemineye distinguished themselves through a highly collaborative approach, demonstrating the mindset of a strategic partner rather than a traditional vendor.

–  Sameer Barua, Director of Data Analytics at DFCU

“The true value of Gemineye is that y’all have lived up to the promise of being our analytics partner and not just another vendor.”

–  Chris Clifford, Data Analyst at Mobility CU

Who is Gemineye?

Gemineye provides data analytics solutions to credit unions and community banks across the country. We believe that regardless of whether you’re a $200M credit union or a $25B bank, you should have access to a data solution that works the way you need it to.

Our signature solution, the Gemineye Data Lakehouse, is the leading industry choice for organizations looking for customization and ownership of their data journey hefty price tag or lengthy timeline. How? By using the same world-class tools that Fortune 50 companies enjoy – Databricks and PowerBI.

We believe the key to success in a data program comes from a partner relationshop with our clients. Our personalized approach to each engagement and comlimentary EaaS ensurethat your specific needs and goals are captured for maximum results.

Our History

Founded
2013
Dedicated to
Financial Institutions
2015
Data Warehouse
Released
2018
Lakehouse
Released
2020
Rebranded
to Gemineye
2023
GemAI
is released
2024
Team continues
to grow
2025

Our Values

You should own your data journey

Your data program shouldn’t be confined to a tiny dark can. We believe that credit unions and community banks deserve to own their data and their data journey. We believe that a practical and usable data program is the key to success. We believe that every financial institution – no matter their size – deserves access to the world-class technology Fortune 50 companies use.

At Gemineye, we take a different approach to data analytics, one that puts our clients back in the driver’s seat of their own data journey. Your data, your definitions, your decision.

persistent

Our Values

A persistent data partner

Innovators at heart, our persistence in problem-solving has made us the clear choice for financial institutions who won’t settle for second best. We pride ourselves on our ability to brainstorm, research, and carve out solutions to tough problems.

Our Values

The very best data team

The Gemineye team consists of data and technology experts with decades of credit union and banking experience, data warehousing design, SQL and ETL development, and API development.

Combined, we create a supergroup of skilled experts with modern sensibilities in the data space. Count on us to provide honest answers, recognize industry-centric trends, and act as a dependable partner in your journey.

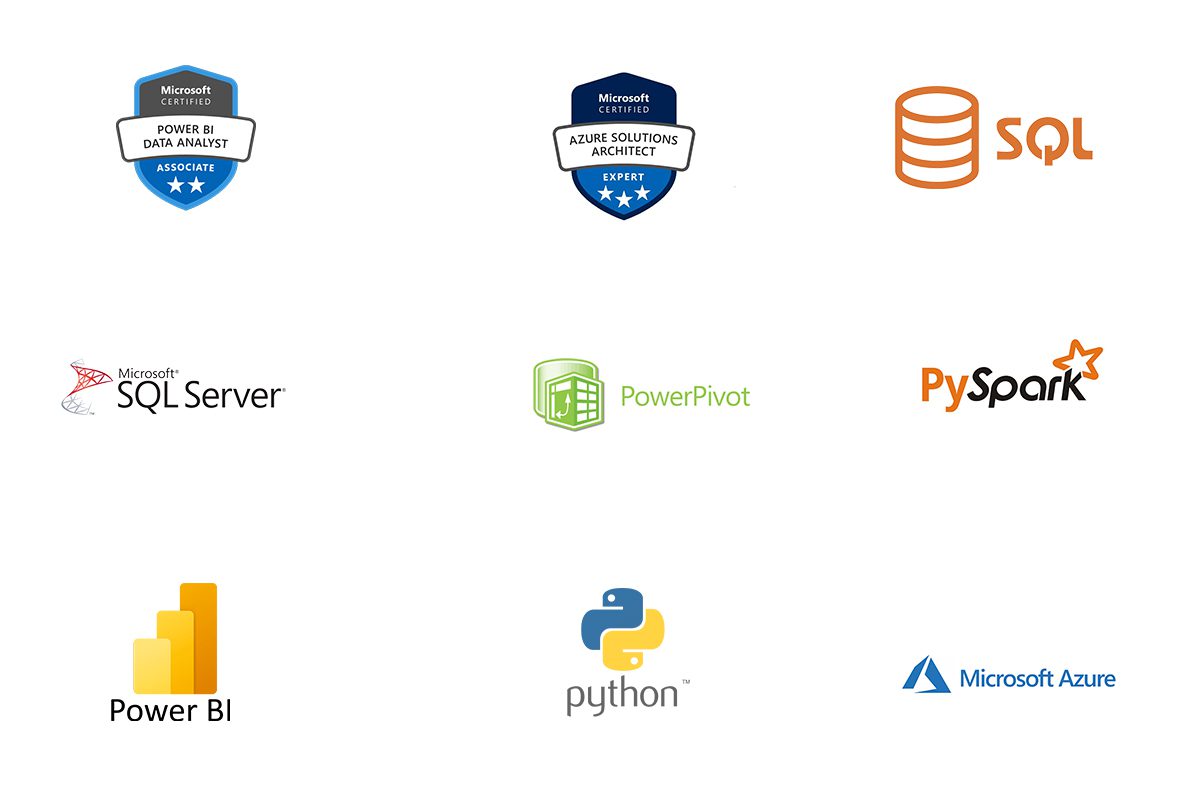
Multiple tech logos on white background
mint green triangle

News and Resources

What to Do When Your Data Outgrows Excel

What to Do When Your Data Outgrows Excel

Microsoft Excel is where almost every financial institution’s data work begins. It is familiar, flexible, and already on every desktop. For years, it does the job. The monthly board report comes out of a spreadsheet. The branch numbers live in a spreadsheet. The incentive calculations, the loan summaries, the customer counts, all spreadsheets. And then, at some point, it stops working as well as it used to. The shift is rarely a single dramatic failure. It is a slow accumulation of friction: reports take longer, files get bigger and slower, one person becomes the only one who understands the master workbook, and small errors start having larger consequences. If that pattern feels familiar, your institution may have outgrown Excel without anyone formally deciding it was time to move on. The Signs Your Institution Has Outgrown Spreadsheets Outgrowing Excel looks different at every institution, but the warning signs are consistent. Reports that used to take an hour now take a day, because the data has to be pulled from more places and stitched together by hand. The same numbers do not match across departments, because everyone maintains their own version. A single analyst has become the keeper of a workbook so complex that nobody else can safely touch it, which means the institution has a key-person risk hiding inside a spreadsheet. In many cases it is not even an analyst doing the work but an executive, and a Chief Lending Officer who spends fourteen hours a month wrestling data inside a spreadsheet is fourteen executive-level hours not spent on strategy, lending growth, or leadership. Other signs are subtler. Decisions wait on data that is always a few weeks old by the time it is compiled. Nobody fully trusts the numbers, so meetings get spent debating whose figures are right instead of what to do about them. These are not signs of a team doing poor work. They are signs that the tool has reached the limit of what it was designed to do. Why Spreadsheets Become a Liability at Scale The core problem with relying on spreadsheets for institutional reporting is that they were never built for it. They were built for individual analysis, and they carry risks that grow as the stakes rise. Decades of academic research have reached a consistent conclusion: errors in operational spreadsheets are both common and serious, and they often go undetected until they have already affected a decision. When a spreadsheet drives a board report or a regulatory filing, an undetected error is not a small inconvenience. It is a real financial and compliance risk. Beyond errors, spreadsheets do not scale with the complexity of a modern financial institution. They cannot easily combine data from the core system, digital banking, loan origination, and third-party sources in a way that stays current. They have no built-in governance, so definitions drift and versions multiply. And they depend entirely on the people who build them, which means institutional knowledge walks out the door when those people leave. What was an asset at a small scale becomes a liability at an institutional one. What to Move Toward When Excel Is No Longer Enough Recognizing that you have outgrown Excel is the first step. The harder question for most executives is what to move toward, especially when the team has no appetite for a massive, disruptive technology project. The goal is not to abandon the kind of analysis the team does today. It is to give that analysis a stronger foundation. That foundation is a data platform that brings all the institution’s sources together automatically, maintains consistent and governed definitions, and delivers reporting that stays current without manual assembly. Instead of an analyst pulling exports and reconciling them by hand each month, the data flows in continuously and the reports update on their own. Instead of every department keeping its own version of the truth, everyone works from the same governed source. The analytical thinking the team already does remains. What changes is that the underlying work of gathering, cleaning, and reconciling data stops consuming all their time. Making the Transition Without Disruption The fear that keeps many credit unions on spreadsheets long after they have outgrown them is the fear of the transition itself. Leaders imagine a multi-year implementation, a steep learning curve, and a long period where nothing works. That fear is understandable, but it is based on an outdated picture of what moving to a modern data platform involves. The right platform is designed to integrate with the systems a credit union already runs, rather than requiring them to be replaced. Implementation is measured in weeks, not years. And because the goal is to make data easier to access, not harder, a well-designed platform reduces the learning curve rather than adding to it. The transition is not a leap into the unknown. It is a step onto firmer ground. Move Beyond Spreadsheets With Gemineye Gemineye’s Operations solution is built for credit unions and community banks that have outgrown spreadsheet-based reporting. Instead of waiting until month-end and assembling reports by hand, teams get detailed daily reporting from data that updates automatically. Manual work like branch incentive calculations, which can consume hundreds of hours a year in a spreadsheet, can be automated entirely. Because the platform unifies more than 75 data sources across core systems, digital banking, originations, and third-party vendors with consistent, governed definitions, your institution finally has one trustworthy source instead of a sprawl of workbooks. Implementation is measured in weeks, not years. If your data has outgrown Excel, see how Gemineye’s Operations solution gives your team a foundation built to scale with you.

Why Your Reporting Is Only as Good as Your Integration Layer

Why Your Reporting Is Only as Good as Your Integration Layer

Every credit union and community bank wants better reporting. Clearer dashboards, more reliable financial analytics, numbers leadership can act on without second-guessing. So institutions invest in reporting tools and dashboard platforms, expecting that better presentation will produce better insight. Often, it does not, and the reason is almost always the same: the problem was never the reporting layer. It was the data feeding it. A dashboard is only as accurate as the data behind it. A financial report is only as trustworthy as the systems it pulls from. When the underlying data is fragmented, inconsistent, or assembled by hand from sources that do not agree with each other, no reporting tool can fix that. The integration layer, the part of the stack that connects and reconciles your data, quietly determines the quality of everything built on top of it. Why Better Dashboards Do Not Fix Bad Data It is tempting to treat reporting problems as presentation problems. If the numbers are confusing or untrustworthy, the thinking goes, a better dashboard will help. But a dashboard does not create accuracy. It displays whatever it is given. If two source systems disagree on what counts as an active member, the dashboard will faithfully display a number that is wrong, just more attractively. McKinsey’s data teams have described this exact failure mode at financial institutions: leadership ends up debating the accuracy of the data instead of acting on the insights. When that happens, the reporting tool is not the problem. The data foundation is. This is why institutions that invest in executive dashboards or financial analytics without first addressing their integration layer are often disappointed. They have improved the window without fixing the view. The reporting looks more sophisticated, but the underlying trust problem remains, because the data still comes from disconnected systems that were never reconciled. What the Integration Layer Actually Does for Reporting The integration layer is the part of a data platform that pulls information from every source (the core system, loan origination, digital banking, the CRM, third-party vendors) and brings it together into a single, consistent foundation. It harmonizes definitions so a term means the same thing everywhere. It reconciles differences so the numbers agree. And it keeps the data current so reports reflect reality rather than a snapshot from three weeks ago. When this layer is working, reporting becomes trustworthy almost as a byproduct. A dashboard pulls from one reconciled source, so the numbers are consistent no matter who views them. A financial report reflects the same customer and account definitions as every other report, so the figures reconcile across departments. The reporting tools finally deliver on their promise, because they are working from data that can actually support them. How Both Data Teams and Executives Experience This Problem The integration gap shows up differently depending on where you sit, but it is the same root cause. For the data team, it appears as endless manual reconciliation: pulling exports, matching records, explaining why two reports disagree, and rebuilding the same logic every reporting cycle. The team knows the reporting is fragile because they are the ones holding it together by hand. For executives, it appears as a quieter erosion of confidence. The numbers in one report do not match another. A figure presented in a board meeting gets challenged and cannot be quickly defended. Over time, leadership learns to treat every number with a degree of skepticism, which slows decisions and undermines the entire purpose of having analytics in the first place. Both experiences trace back to the same place: data that was never properly connected before it reached the report. Why Data Lineage and Consistent Definitions Matter Two capabilities separate an integration layer that produces trustworthy reporting from one that does not. The first is consistent, governed definitions: the assurance that a field means the same thing everywhere it appears, so reports reconcile by design rather than by manual effort. The second is data lineage, the ability to trace exactly how a number moved from its source system through the platform and into a report. Lineage matters because trust requires verification. When an executive questions a figure, the data team should be able to show precisely where it came from and how it was calculated, rather than launching an investigation. When that traceability exists, confidence in reporting is durable, because it can be confirmed rather than merely asserted. Without it, every disputed number becomes a research project, and trust never fully takes hold. How Gemineye Builds Reporting You Can Trust Gemineye’s Data Integrations solution exists to give credit union and community bank reporting a foundation it can rely on. With more than 75 pre-built integrations connecting the core system, loan and mortgage origination, digital banking, CRM, and third-party data vendors, Gemineye brings every source into one reconciled environment. Consistent, customizable definitions mean a number means the same thing across every report, and end-to-end data lineage with a transparent data dictionary lets your team trace exactly how each field moves from source to dashboard. The result is that the dashboards and financial analytics your teams depend on are finally built on data they can trust. If your reporting is not as reliable as it should be, the place to start is the integration layer underneath it. See how Gemineye’s Data Integrations solution gives your reporting a foundation worth building on.

How to Eliminate Reporting Bottlenecks That Slow Down Credit Union and Community Bank Operations

How to Eliminate Reporting Bottlenecks That Slow Down Credit Union and Community Bank Operations

At most credit unions and community banks, getting a report means asking someone. A branch manager needs performance numbers, so they email the analyst. A CFO wants an updated view before a board meeting, so they put in a request and wait. Marketing needs a member segment, so they join the queue behind everyone else. Every one of these requests routes through the same small group of people, and every one of them waits. This is the reporting bottleneck, and it quietly shapes how fast a credit union can move. When every question about the business has to pass through a person who is already overloaded, decisions slow down, the data team burns out, and the institution operates a step behind where it could be. The good news is that the bottleneck is fixable, and fixing it benefits everyone involved. What Causes Reporting Bottlenecks at Financial Institutions A reporting bottleneck is not a sign that the data team is slow or disorganized. It is a structural feature of how most credit unions are set up to access information. The data lives in systems that require technical knowledge to query. The logic for turning raw data into a usable report exists in the heads of a few specialists. So every request, no matter how routine, has to go through those specialists. The result is a queue. Simple, repetitive requests sit in the same line as complex, strategic ones. The analyst spends the bulk of their time producing the same recurring reports instead of doing higher-value work. And the people who need answers learn to either wait or do without. The bottleneck is built into the structure, which is exactly why working harder does not relieve it. The Hidden Cost of Putting a Person Between Teams and Their Data When every report requires a request to a specialist, the costs add up in ways that are easy to miss. Decisions get delayed while people wait for numbers. Stakeholders stop asking questions they would ask if the answer were instant, which means opportunities go unexamined. And the data team, instead of working on analysis that moves the institution forward, spends its days as a report-generation service. This dynamic is well understood in analytics research. McKinsey has described how leading analytics organizations deliberately move their specialists away from fulfilling routine requests and toward higher-value work, building reports and dashboards that business users can access themselves. The institutions that get this right do not just relieve the bottleneck. They free their most skilled people to focus on the work only they can do. Why Self-Service Access Is the Real Solution The durable fix for a reporting bottleneck is not hiring more analysts to process requests faster. It is removing the need to make a request for routine information in the first place. When a branch manager can pull their own performance dashboard, when a CFO can see a current financial summary without asking, when marketing can build a segment on their own, the queue shrinks dramatically. This is what self-service access means in practice: giving the people who need information a safe, governed way to get it themselves, without routing every question through the data team. It does not eliminate the data team’s role. It redefines it. Instead of generating the same reports over and over, the team designs the environment, governs data quality, and takes on the strategic analysis that actually requires their expertise. Importantly, self-service done well does not mean data chaos. The goal is not everyone building their own conflicting reports from raw data. It is a governed environment where the definitions are consistent, the data is trustworthy, and access is structured. That balance, between freedom to access and confidence in the numbers, is what separates effective self-service from a new set of problems. What Financial Institutions Need to Make Self-Service Work Self-service access depends on a foundation that most credit unions and community banks do not have by default. The data from across the core system, digital banking, loan origination, and other sources has to be brought together into one place. The definitions have to be consistent, so a number means the same thing no matter who pulls it. And the experience has to be approachable enough that a non-technical user can get what they need without writing a query. Without that foundation, self-service is not possible, and the bottleneck persists. With it, the entire dynamic changes. Routine requests disappear from the queue because people serve themselves. The data team gets its time back. And decisions across the institution speed up because the information is finally within reach of the people who need it. Over the course of a year, one community bank using Gemineye saw exactly this shift take hold. “Our people are engaging, and with engagement comes more questions and more thoughts. The nature of the questions have changed,” explained the institution’s BI manager. “Some of them are enhancement requests or strategic ideas for down the road. Some are as fundamental as a request for training so that they can understand how to gather their own results without needing us.” How Gemineye Removes the Reporting Bottleneck Gemineye’s Operations solution is built to take the bottleneck out of credit union and community bank reporting. Instead of waiting on month-end or on a specialist’s availability, teams get detailed daily reporting they can work from directly. Recurring manual work, such as branch incentive calculations that once consumed hundreds of hours a year, can be automated so it no longer clogs the queue at all. Because the platform unifies more than 75 data sources across core systems, digital banking, originations, and third-party vendors with consistent, governed definitions, the information teams pull is both accessible and trustworthy. That is the combination self-service requires. If your institution is moving slower than it should because every report runs through the same few people, see how Gemineye’s Operations solution gives your teams the access they need without sacrificing control over your data.

Showing Slide 1 of 4