Dashboards

A powerful, prebuilt dashboard solution leveraging the world’s leading data analytics platform, Power BI.
test
test
test

Integrations Include:

It seems we can't find what you're looking for.

veridian
us community
university
third federal
sunmark
sscu
space coast
peak
nusenda
numark
logix
leaders
gesa
dfcu
credit union 1
Communitywide
CapEd
cape and coast
4front
Suncoast CU
Quorum
P1FCU

Access the same technology that Fortune 50 companies use

Visualizations
PowerBI
The Data Lakehouse
Transparent Data Dictionary

Profitability at the most granular level

Don’t assume profitability based on “averages of averages”. Connect to your data at the most granular level including interchange on transactions and interest spreads on individual products. 

Related

CUSTOMERS INSIGHTS

Powerful ML/Al-driven engagement,
segmentation, and predicitive actions

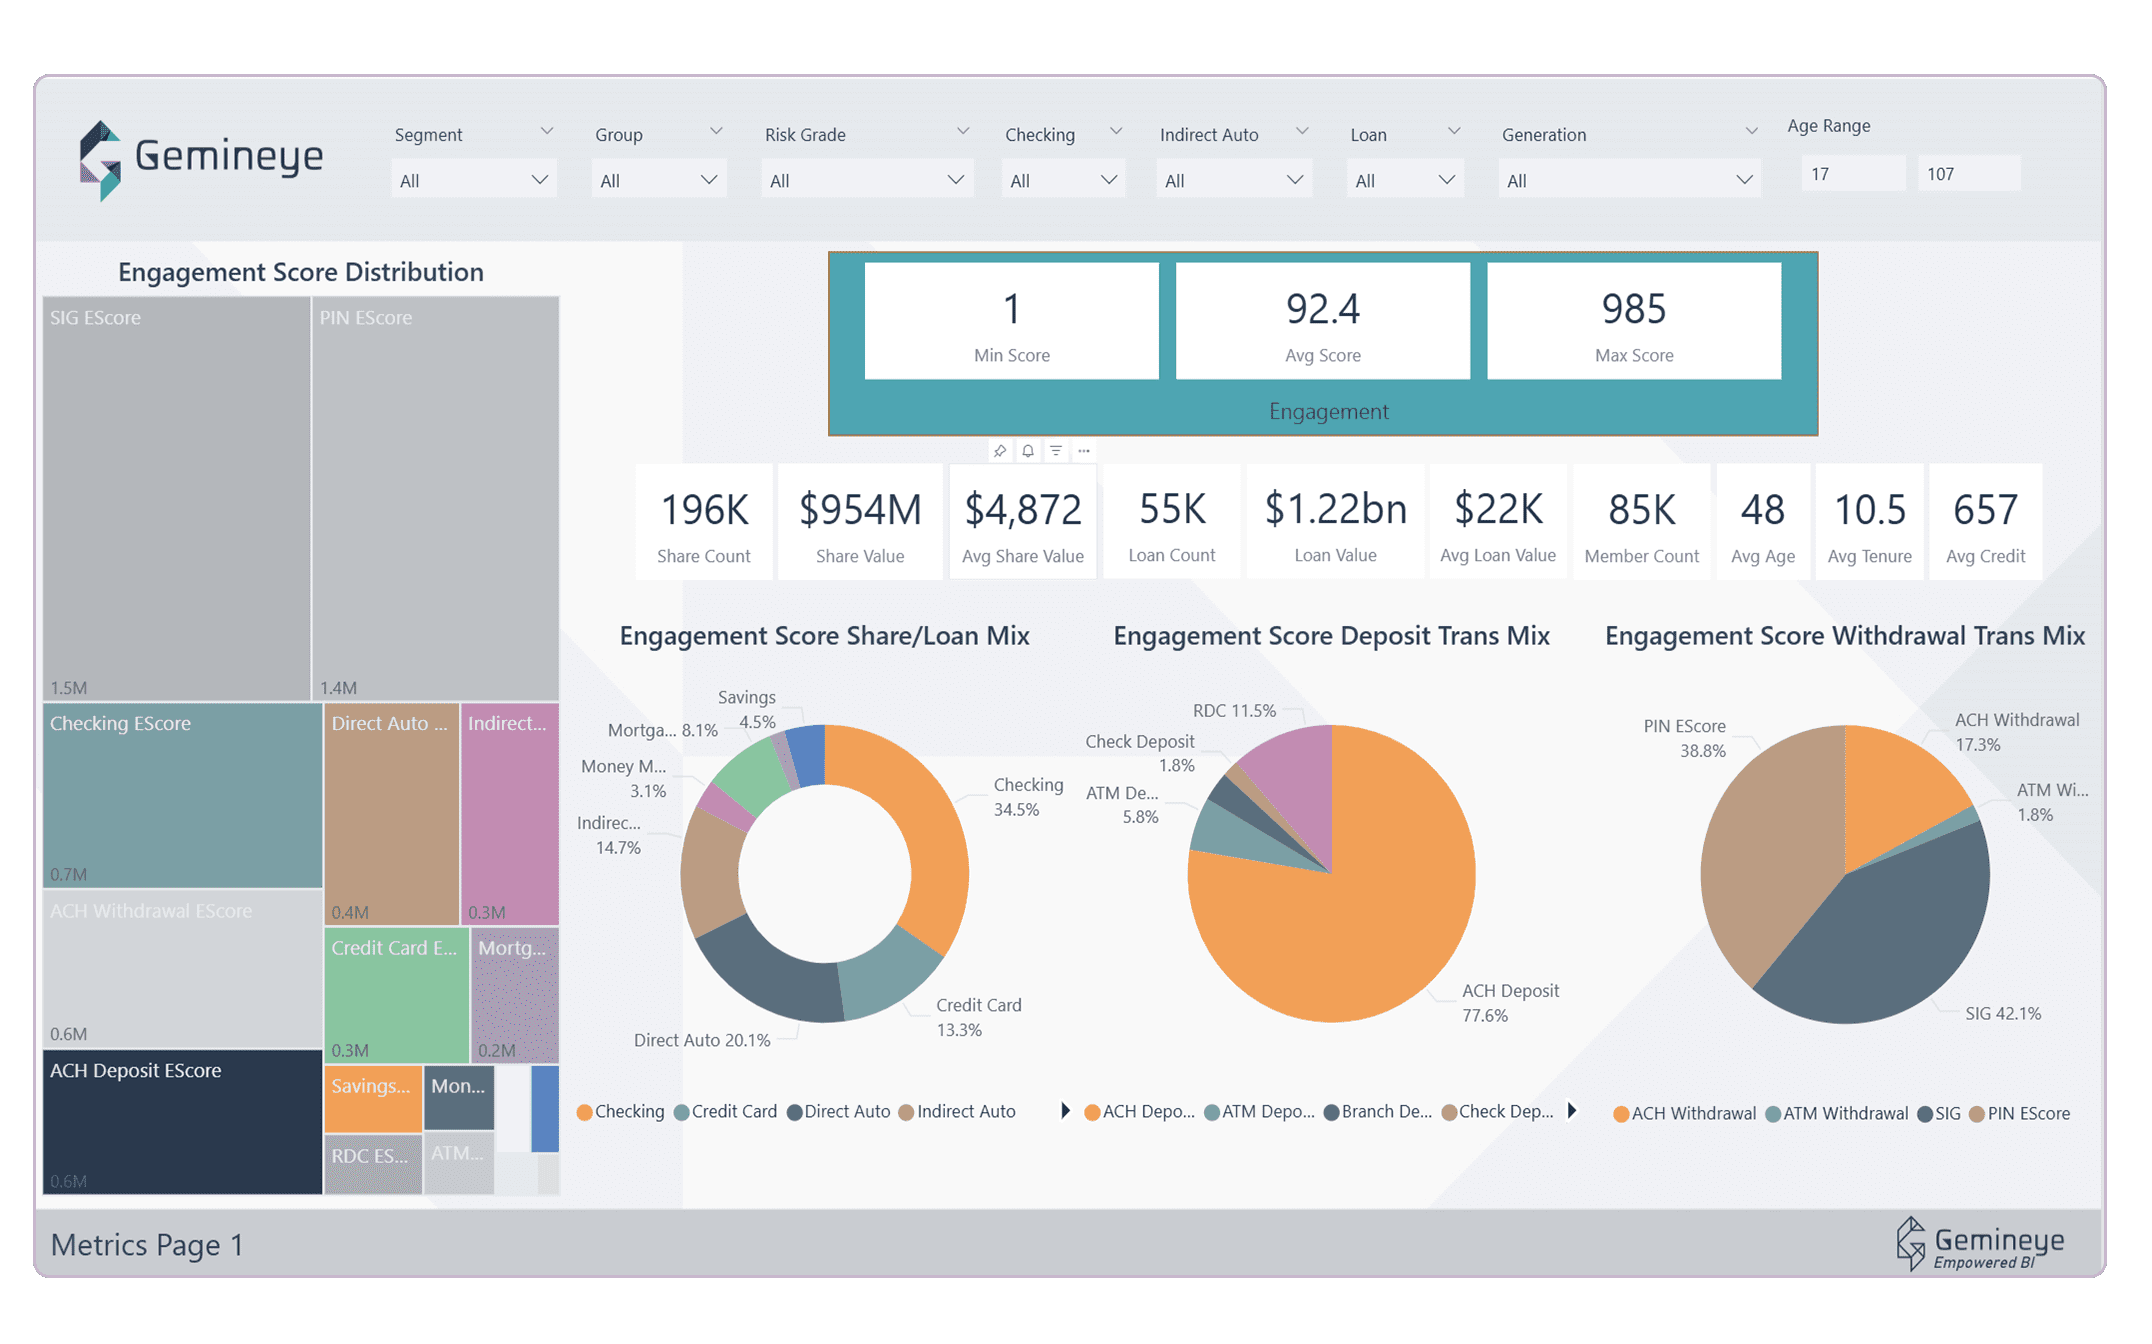
Gemineye data lakehouse metrics summary

Definition Customization

Definition Customization documents fully integrated into the solution and design to ensure your team knows exactly how all fields move from source to the data warehouse to the dashboards and reports.

Advanced Lakehouse Monitoring

Advanced Lakehouse Monitoring documents fully integrated into the solution and design to ensure your team knows exactly how all fields move from source to the data warehouse to the dashboards and reports.
Gemineye data lakehouse metrics summary

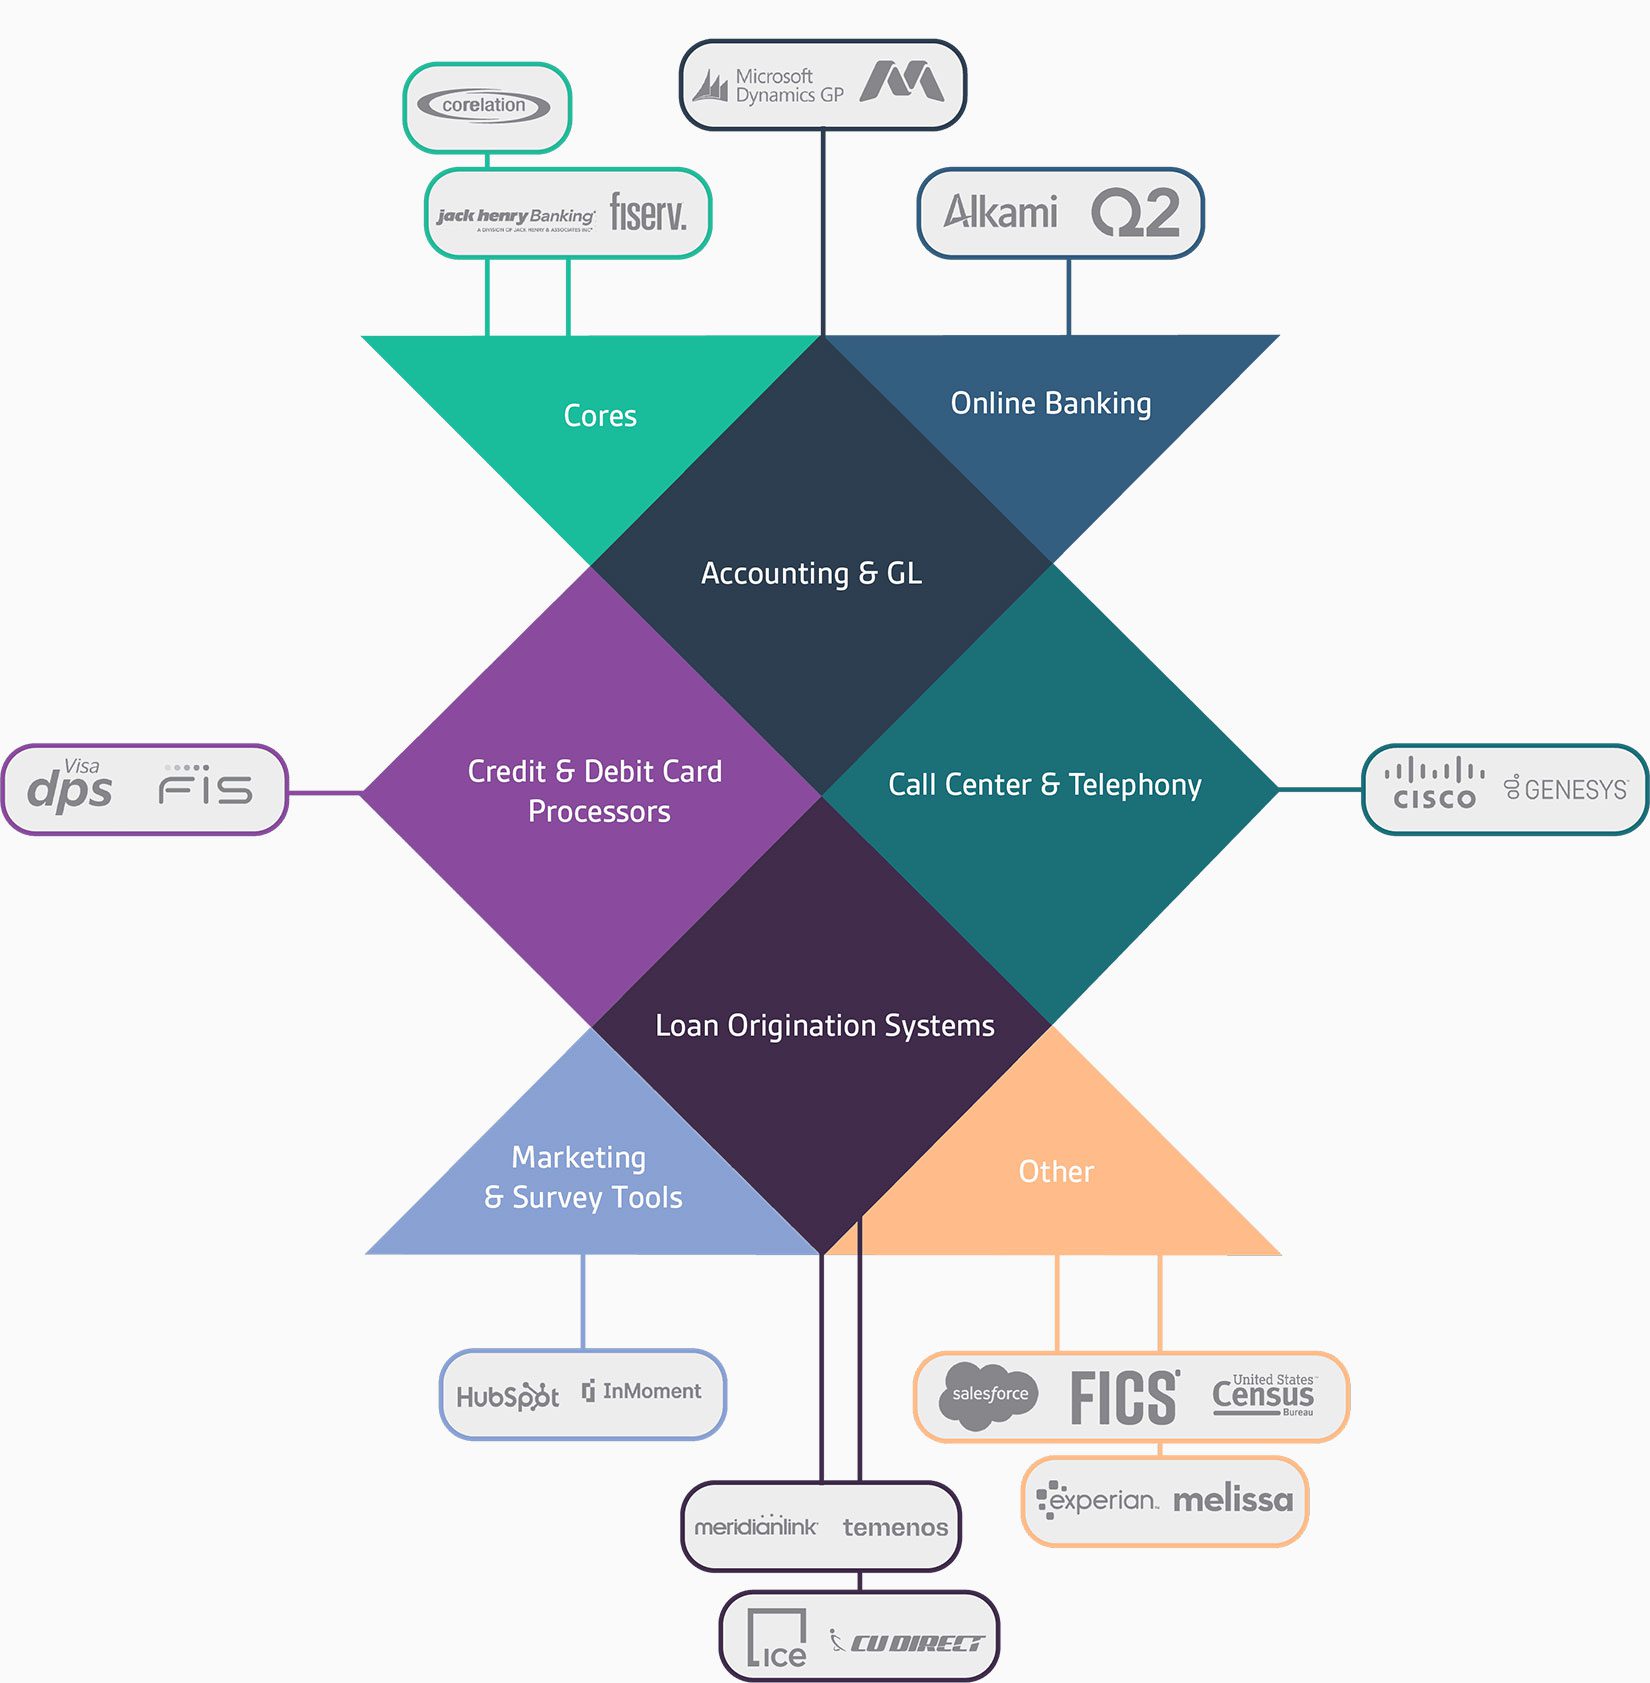
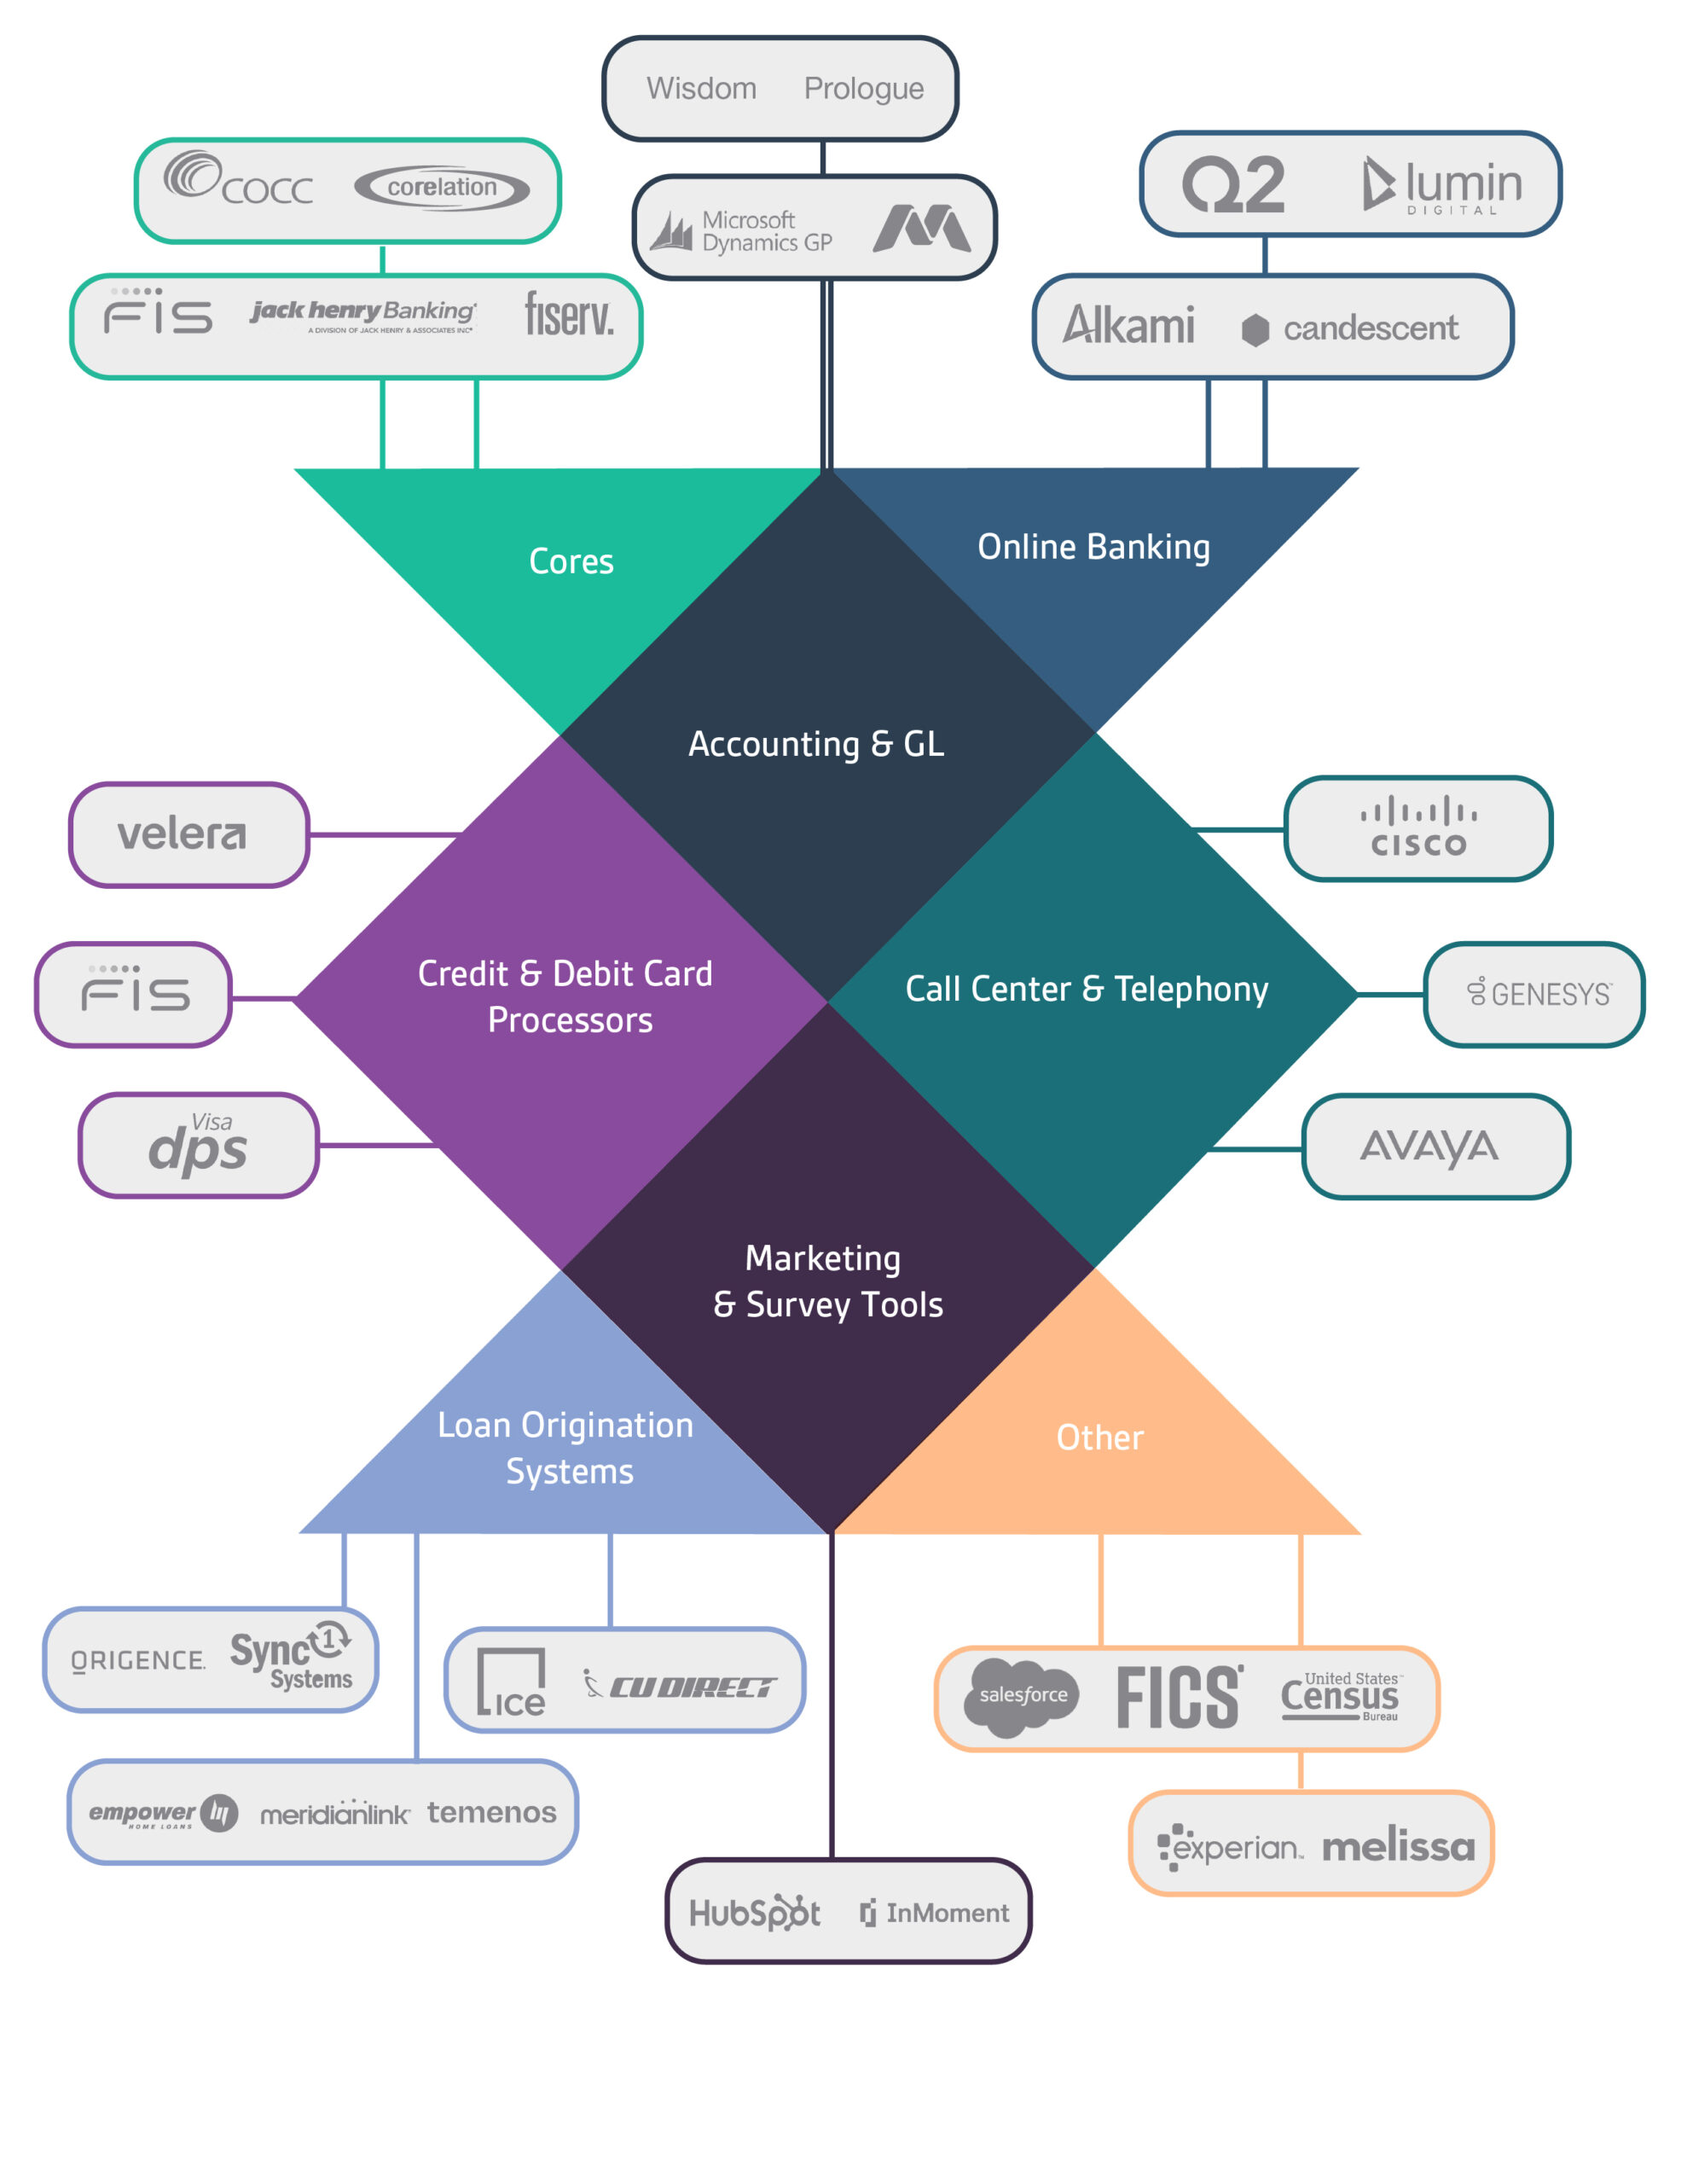
75 integrations and counting

We currently support over 75 integrations – even the ones that other data analytics providers won’t touch. Our integrations incorporate leading credit union and bank solutions, like consumer loan and mortgage originations, digital banking, CRM / MRM, third-party data vendors, and more.

Gemineye integrations infographic

Over 250 visualizations at your fingertips

The Gemineye Data Lakehouse comes standard with over 250 pre-built reports, dashboards, visualizations, and data models that cover nearly every possible need. Built in PowerBI, we cover: Credit Risk Analysis Loan Origination Teller Transaction Reporting Branch Transaction Reporting Loan Portfolio Dashboards Share Portfolio...and many more
Gemineye data lakehouse metrics summary

Why PowerBI?

Power BI is a best-in-class business intelligence platform from Microsoft that packs a mighty punch. Leveraging Microsoft’s user-friendly design, PowerBI transforms data from various sources into interactive dashboards and analytics reports that your whole team can use.
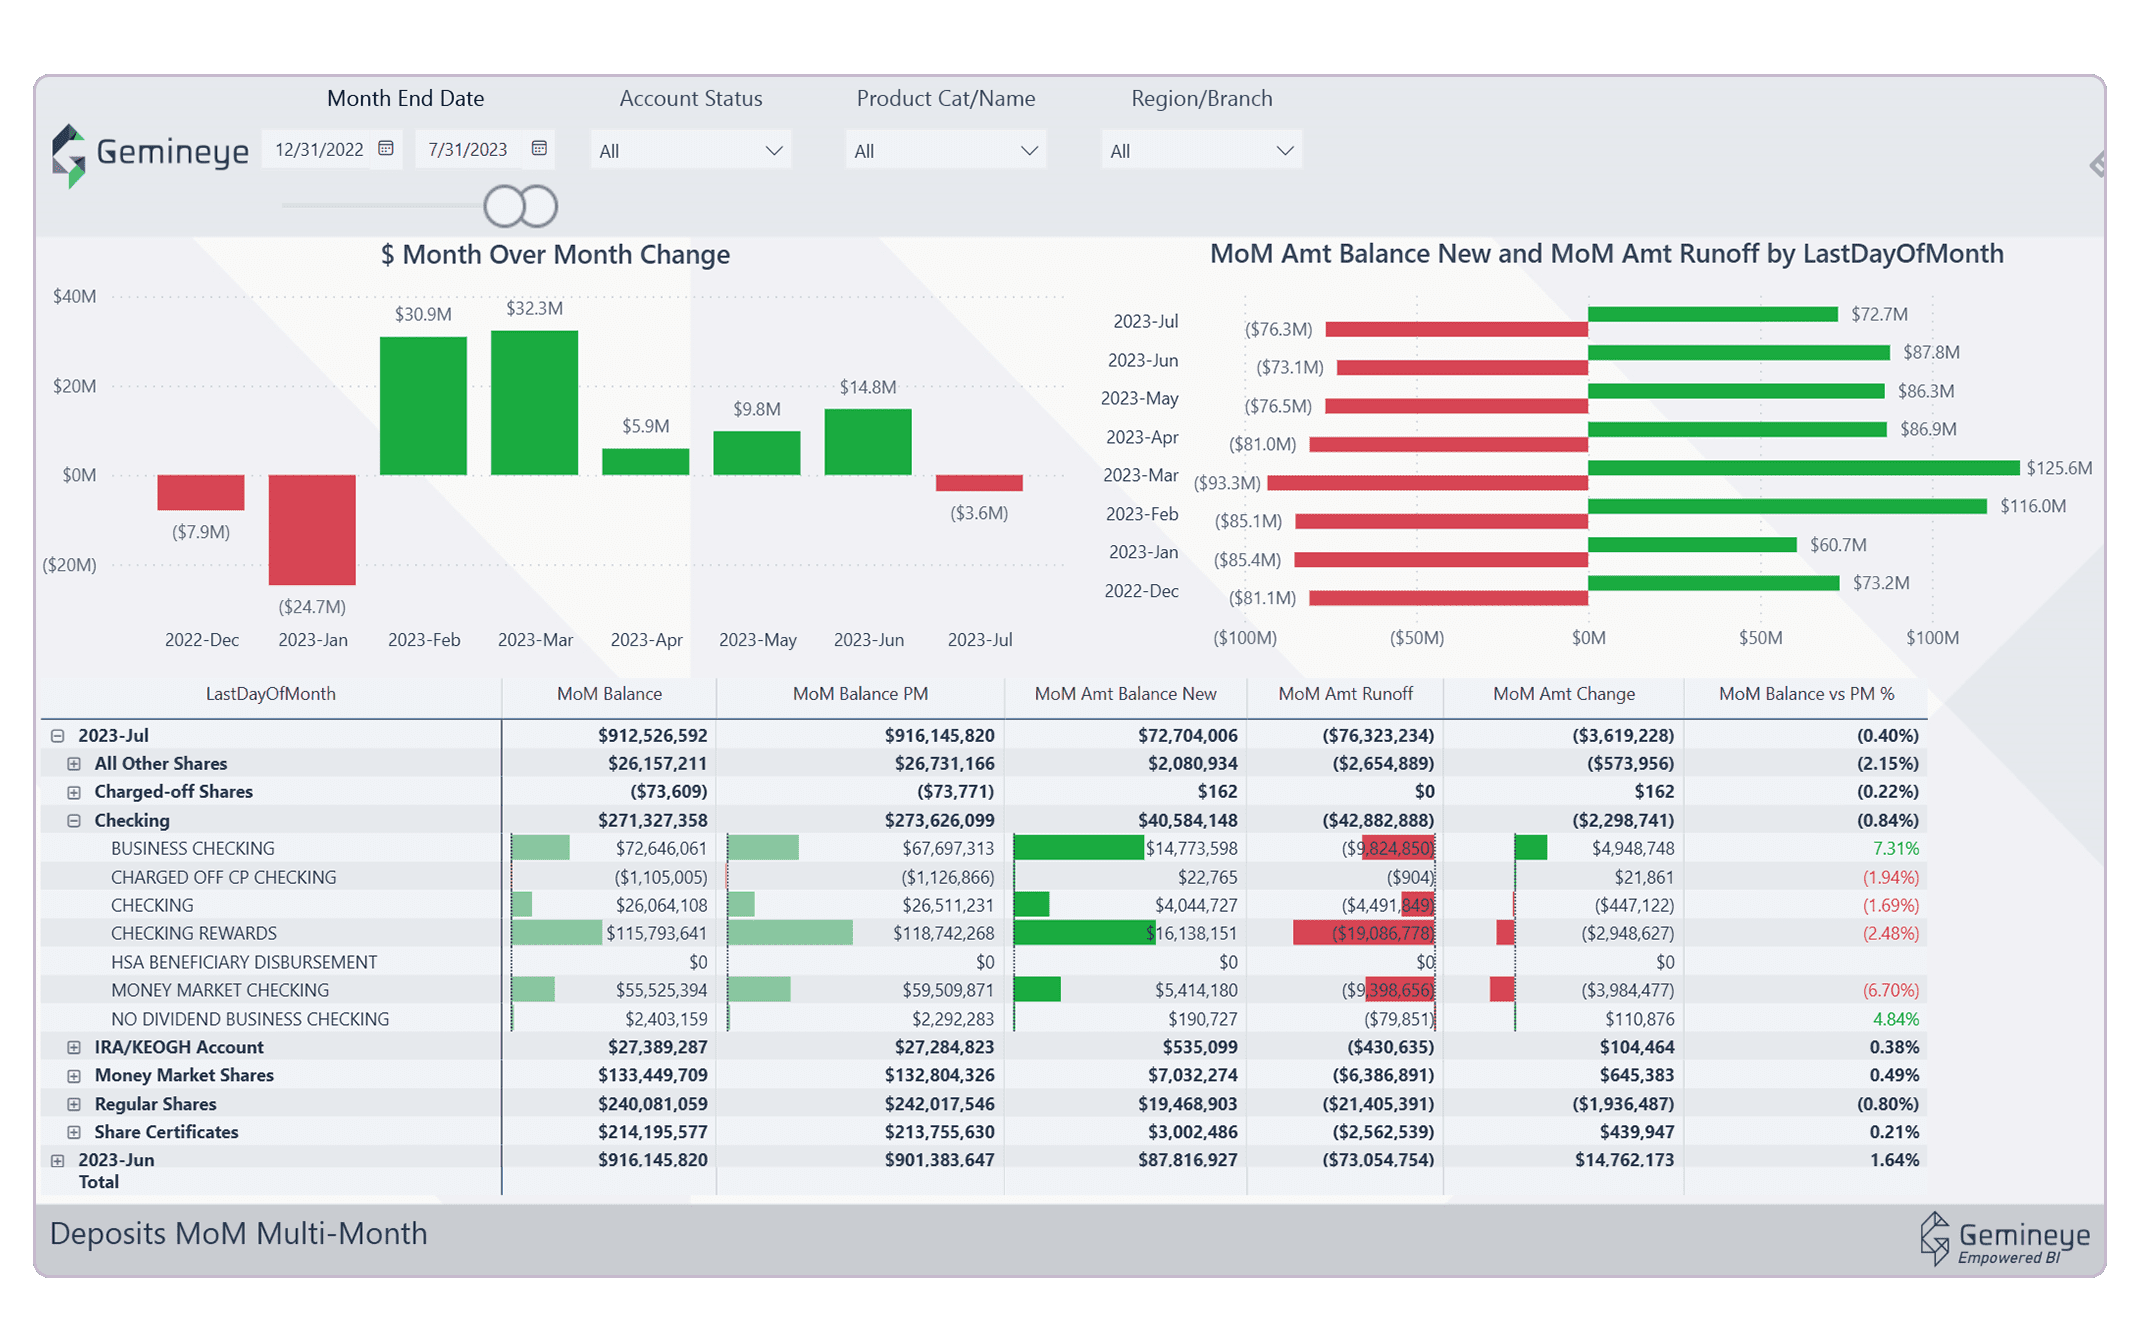
Gemineye data lakehouse deposit accounts by product category

The strength of a data lakehouse

The best of a data warehouse and a data lake, The Gemineye Data Lakehouse stands above the rest in efficiency, ease-of-use, and data privacy. The Gemineye Data Lakehouse allows for the storage of your data in a raw format, but uses tools like a warehouse to make that data easy for business intelligence, reports, data science and analytics, and machine learning.
Gemineye data lakehouse month over month balances vs runoffs

Hear from Our Clients

Selecting Gemineye as our analytics partner was pivotal for us to establish a robust data warehouse right from the outset. Their proficiency in leveraging Azure and Databricks technology is unparalleled. Gemineye not only possesses exceptional expertise but also proves to be an invaluable partner, wholeheartedly dedicated to aiding us in realizing our data analytics objectives.
Clint Johnson-Data Analytics
Clint Johnson
VP of Data & Analytics
P1FCU
Purple quote icon
Purple quote icon

Over 250 visualizations at your fingertips

The Gemineye Data Lakehouse comes standard with over 250 pre-built reports, dashboards, visualizations, and data models that cover nearly every possible need. Built in PowerBI, we cover: Credit Risk Analysis Loan Origination Teller Transaction Reporting Branch Transaction Reporting Loan Portfolio Dashboards Share Portfolio...and many more
Gemineye data lakehouse metrics summary

Why PowerBI?

Power BI is a best-in-class business intelligence platform from Microsoft that packs a mighty punch. Leveraging Microsoft’s user-friendly design, PowerBI transforms data from various sources into interactive dashboards and analytics reports that your whole team can use.
Gemineye data lakehouse deposit accounts by product category

The strength of a data lakehouse

The best of a data warehouse and a data lake, The Gemineye Data Lakehouse stands above the rest in efficiency, ease-of-use, and data privacy. The Gemineye Data Lakehouse allows for the storage of your data in a raw format, but uses tools like a warehouse to make that data easy for business intelligence, reports, data science and analytics, and machine learning.
Gemineye data lakehouse month over month balances vs runoffs

75 integrations and counting

We currently support over 75 integrations – even the ones that other data analytics providers won’t touch. Our integrations incorporate leading credit union and bank solutions, like consumer loan and mortgage originations, digital banking, CRM / MRM, third-party data vendors, and more.

Gemineye data analytics integrations

How Financial Institutions Connect Core Systems, CRM, and LOS Without Rebuilding Everything

If you run data or analytics at a credit union or community bank, you already know the integration problem intimately. Your core banking system holds the transactional truth. Your loan...
READ NOW

Dashboards FAQs

How Can Dashboards Help Your Team?

Conquer a tough lending environment with tools that reveal opportunities and risks alike

Deliver long-awaited autonomy and flexibility to your finance team

Hard-working analytics for hard-working operations teams

mint green triangle
mint green triangle

News and Resources

Cutting the Crap on Organizational KPIs

Join Gemineye and $21B, 75 branch Suncoast Credit Union for a webinar on creating realistic organizational KPIs and calling out the nonsense numbers that derail goals…you know, the crappy ones. Featuring special guest Nolan Walker, VP of Business Intelligence at Suncoast CU, this webinar reveals how one of the largest credit unions in the US is creating and managing their organizational KPIs through analytics and cutting-edge AI contextual technology – and how you can, too. 👉 RSVP here Walker and the Gemineye Team will discuss: Why organizational KPI creation is one of the most under-invested aspects of a data program The importance of starting at the top with organizational metrics and why it’s still so important to standardize definitions The common challenges teams face when defining the KPIs that matter The cultural shift that occurs when the organization can align on goals What direction to take when insights no one would have expected are revealed   There will be plenty of time to share your thoughts, receive feedback, and ask additional questions. Who Should Attend? Credit Union / Community Bank Leaders and Practitioners in: Information Technology & Systems Analytics and Business Intelligence Organizational Strategy & Innovation Event Information: Date: Wed, Oct 14, 2026 Time: 2:00 PM – 3:00 PM (EDT) 👉 RSVP here We hope to see you on the webinar!

Heritage Financial CU Selects Gemineye to Develop a Centralized, Governed Data Program

Sandwich, Mass (October 6th, 2026) –  $800M, Hudson Valley, NY-based Heritage Financial (HFCU) has selected Gemineye to help them build a best-in-class, centralized data analytics program that can grow as they grow.  With 14 branches in and around the Hudson Valley Region, HFCU is heavily invested in community efforts that make this unique region stronger. Heritage Financial found Gemineye’s specific focus on credit unions and community banks – they do not work with any other industries as many competitors do – to be a big differentiator. Combined with Gemineye’s emphasis on creating a single source of truth as part of their data foundation, and the platform’s speed to value, the partnership made sense. “We chose Gemineye because they understood what we need from our data and why it matters. Giving employees faster access to reliable information will reduce manual work, strengthen decision-making, and help our teams better understand member needs and improve their experience,” says Gregory Beckwith, Vice President of Innovation & Operations at Heritage Financial. “The Heritage Financial team conducted a rigorous partner search with a focus on immediate value and long-term scalability,” says Maggie Chopp, Director of Business Development at Gemineye. “We are delighted to welcome them to the client group and eager to see their analytics capabilities take off.” “This partnership gives Heritage the foundation to move forward with analytics, automation, and AI in practical ways that improve how we operate and serve our members,” continues Beckwith. Gemineye is proud to welcome this competent and progressive credit union to their team. About Heritage Financial Heritage Financial Credit Union (HFCU) provides a safe, secure place for members to save their hard-earned money and offers affordable loans with competitive rates. In times of uncertainty caused by financial crisis and mistrust of larger banks, HFCU seeks to provide safety in community and a cooperative member base. They do not define financial success, but urge their members to affirm their own success. HFCU provides the necessary tools and resources to get you there. Together. Learn more about Heritage Financial at heritagefcu.com. See Gemineye’s Data Lakehouse in Action Interested in learning how the Gemineye Data Lakehouse can support your data governance and scalability requirements like Heritage Financial? Schedule a personalized discovery call to see how our platform can transform how your institution’s data program.

What Operations Data Can Tell You That Financial Data Cannot

At most credit unions and community banks, the financial reports are the reports. The monthly financials, the board package, the performance summary: these are what leadership reviews, discusses, and makes decisions from. They are essential, and they are also incomplete. Financial data is very good at telling you what happened. It is far less good at telling you why it happened, or what is about to happen next. For those answers, you need a different kind of data entirely. Operational data, the information about how your institution actually runs day to day, answers the questions financial data cannot. It captures the activity that eventually becomes a number on a statement. Paying attention to both is what separates an institution that reacts to its results from one that shapes them. Why Financial Reports Only Tell You What Already Happened A financial statement is a record of the past. By the time a result lands in a monthly report, the activity that produced it is weeks or months gone. If loan yield slipped, the financials will confirm it slipped, but only after the quarter closed and only in aggregate. They will not tell you which branches, which products, or which member and customer segments drove the change, and they will not tell you in time to do anything about it while it is happening. This is what financial data is for: it measures outcomes. The problem arises only when an institution treats outcome data as its sole lens, because outcomes are the one thing you can no longer influence by the time you see them. A soft quarter shows up clearly in the financials, but the financials cannot tell you what to do about it, because the causes they summarize are already in the past. What Operational Data Reveals About Why Results Change Operational data captures the activity beneath the financial result. Where the financials show that new account growth was down, operational data shows the branch traffic patterns, the onboarding completion rates, and the staffing levels that explain the decline. Where the financials show a dip in a product line, operational data shows the product penetration trends across branches that reveal where and why interest fell off. This is the difference between knowing a number and understanding it. The financials can show that a result moved, but the explanation, and therefore the fix, lives in the operational data underneath. When the two are connected, a disappointing result stops being a mystery to be debated in a meeting and becomes a problem with a visible cause and an addressable solution. Mobility CU, a Gemineye data lakehouse client, offers a useful example. How much the credit union recovered on car repossessions is the financial report. Which reseller is yielding the highest margin is the operations report. How Operational Signals Warn You Before the Financials Do The most valuable thing operational data offers is time. Because it sits upstream of the financials, it moves first. A decline in onboarding completion shows up in the operational data this month, well before it shows up as reduced product adoption and lower revenue in next quarter’s financials. A shift in branch service patterns is visible immediately, long before it registers as a change in member or customer retention numbers. This early visibility is what turns management from reactive to proactive. An institution watching only its financials finds out about problems after they have already cost money. An institution watching its operational data sees the warning signs while there is still time to respond, which means many problems get solved before they ever reach the financial statement at all. The financials still matter, but they become confirmation of good management rather than the first notice of a problem. Why Both Data Types Belong in the Same View None of this argues for replacing financial data. It argues for pairing it with operational data so that each makes the other more useful. Financial data tells you the result. Operational data tells you the cause and the early warning. Seen together, they let leadership move from asking what happened to asking why, and from reacting to results to shaping them before they land. The obstacle for most institutions is that these two kinds of data live in different systems that were never connected. The financials come from the core and the general ledger. The operational data is scattered across core, digital banking, branch systems, origination, and service platforms. Bringing them into one view, where an operational trend can be seen alongside the financial result it explains, is what makes the full picture possible. Without that connection, leadership is left with half the story and no reliable way to assemble the rest. See the Full Picture With Gemineye Understanding why your results change, and seeing the warning signs early, depends on bringing operational and financial data into one connected view. Gemineye’s Operations solution connects the systems behind your institution and delivers detailed daily reporting on the operational activity, from branch performance and staffing to product penetration and onboarding, that explains what your financials can only report after the fact. See how Gemineye helps credit unions and community banks manage from the full picture rather than half of it.
Ready to finally have control over your data analytics experience?

We offer complimentary consultations – never pushy, always honest.