Marketing

A marketing-centric platform to easily find and segment your customers to reach the right audience.
test

Integrations Include:

It seems we can't find what you're looking for.

Make marketing decisions based on data, not guesswork

Marketing Lists
Pre-Built Reporting
AI Insights
Customer Sentiment Analysis
Transparent Data Dictionary

Profitability at the most granular level

Don’t assume profitability based on “averages of averages”. Connect to your data at the most granular level including interchange on transactions and interest spreads on individual products. 

Related

CUSTOMERS INSIGHTS

Powerful ML/Al-driven engagement,
segmentation, and predicitive actions

Gemineye data lakehouse metrics summary
Definition Customization
Gemineye data lakehouse metrics summary

Definition Customization

Definition Customization documents fully integrated into the solution and design to ensure your team knows exactly how all fields move from source to the data warehouse to the dashboards and reports.

Advanced Lakehouse Monitoring

Advanced Lakehouse Monitoring

Advanced Lakehouse Monitoring documents fully integrated into the solution and design to ensure your team knows exactly how all fields move from source to the data warehouse to the dashboards and reports.
Gemineye data lakehouse metrics summary

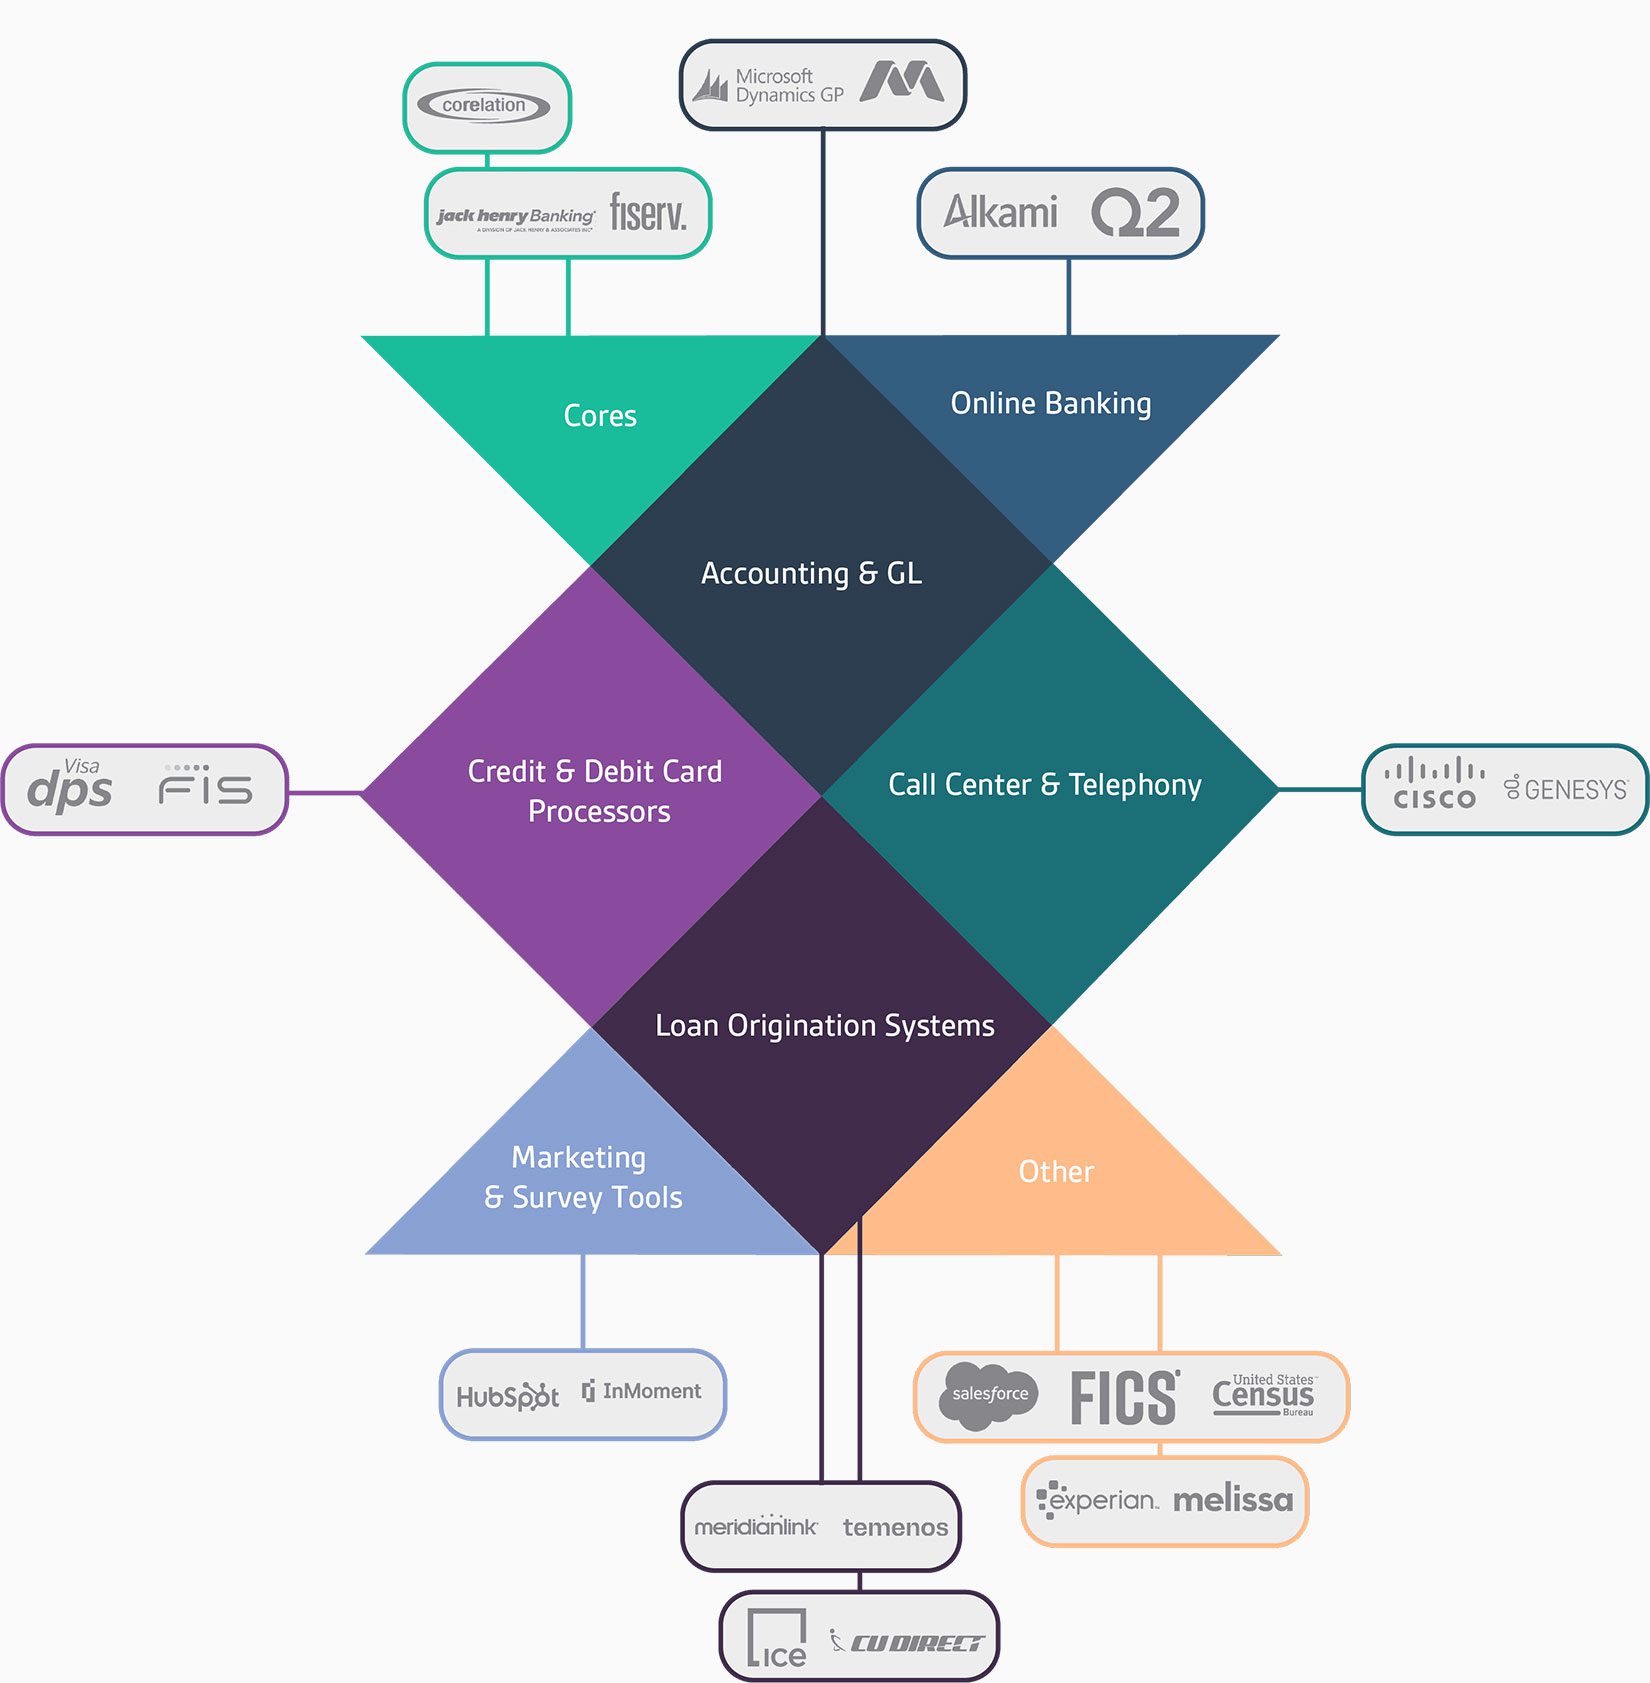
75 integrations and counting

We currently support over 75 integrations – even the ones that other data analytics providers won’t touch. Our integrations incorporate leading credit union and bank solutions, like consumer loan and mortgage originations, digital banking, CRM / MRM, third-party data vendors, and more.

Gemineye integrations infographic

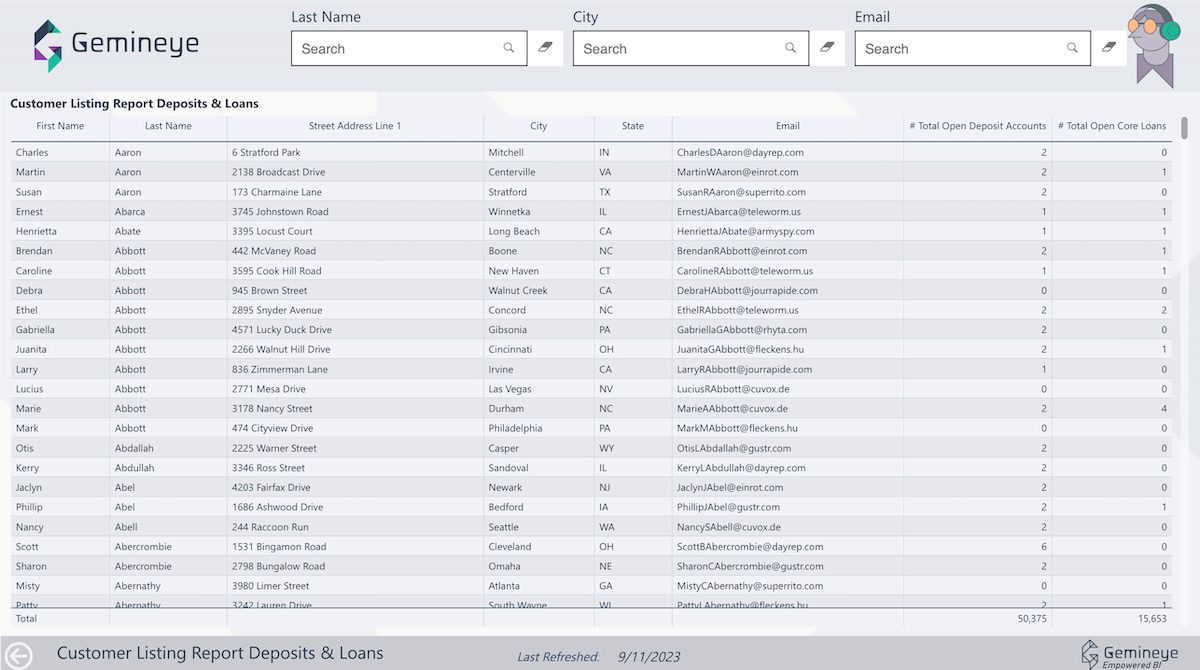
Marketing lists made easy

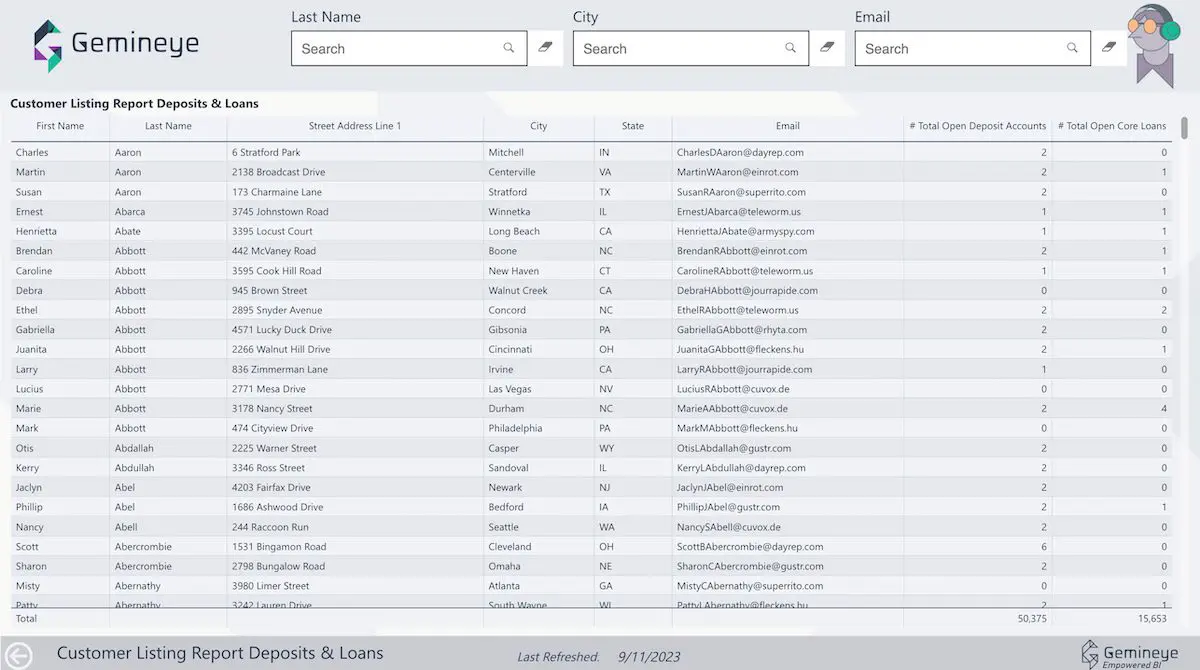
Gemineye makes those tedious marketing list generation activities simple and seamless. From our thousands of attributes, you can easily filter down based on product and service utilization, demographic attributes, tenure, location, etc. to feed to your marketing campaign tools.
Gemineye Data Lakehouse customer listing report for deposits and loans

Marketing lists made easy

Gemineye makes those tedious marketing list generation activities simple and seamless. From our thousands of attributes, you can easily filter down based on product and service utilization, demographic attributes, tenure, location, etc. to feed to your marketing campaign tools.
Gemineye Data Lakehouse customer listing report for deposits and loans

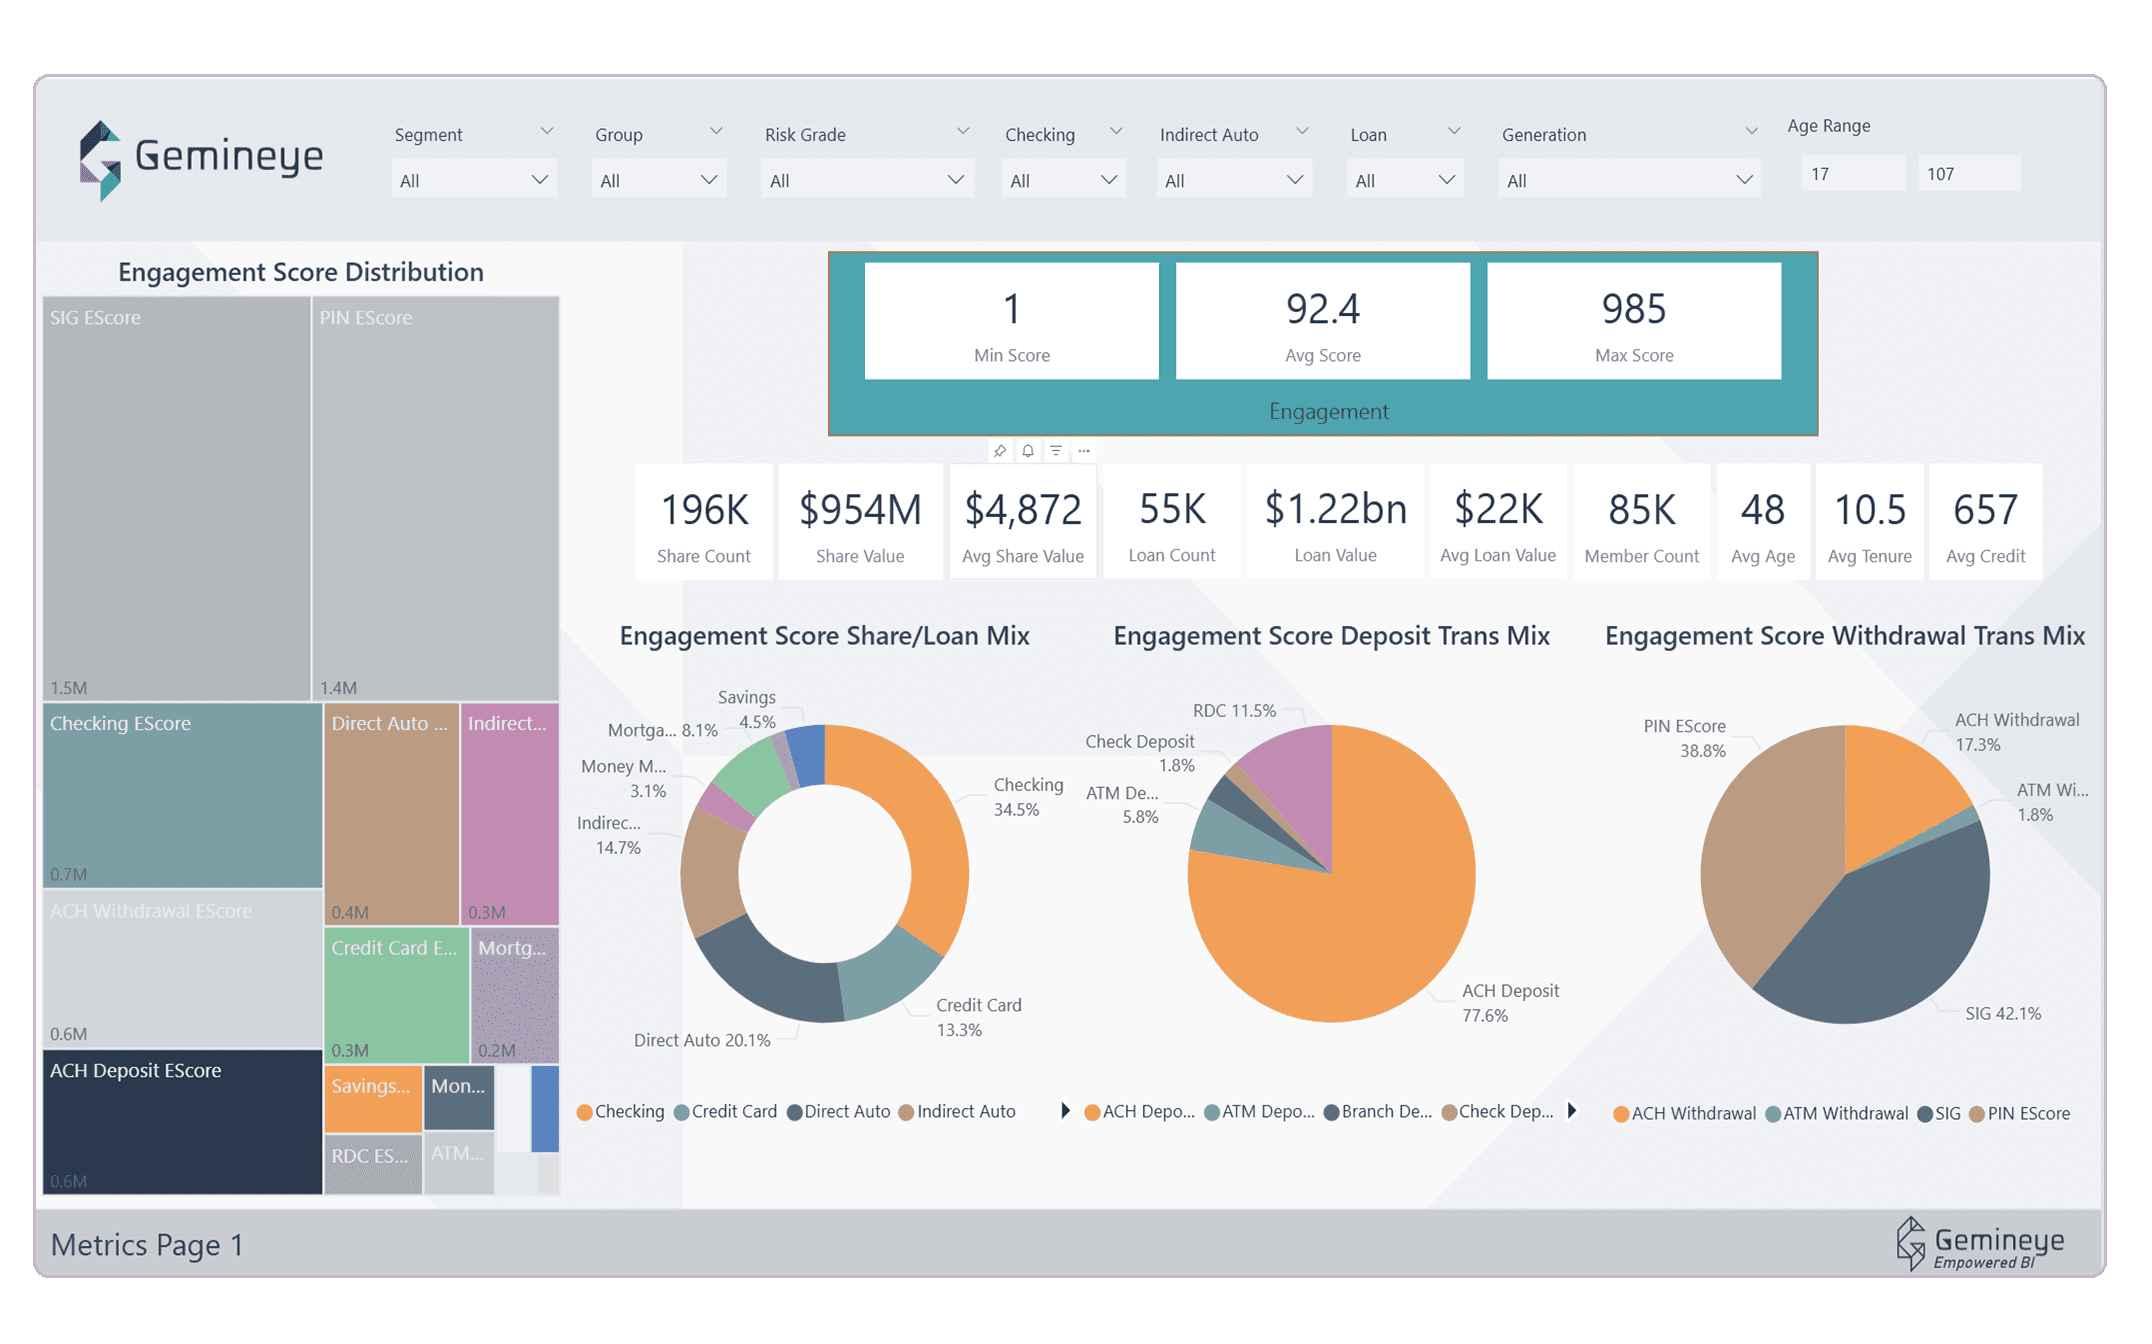
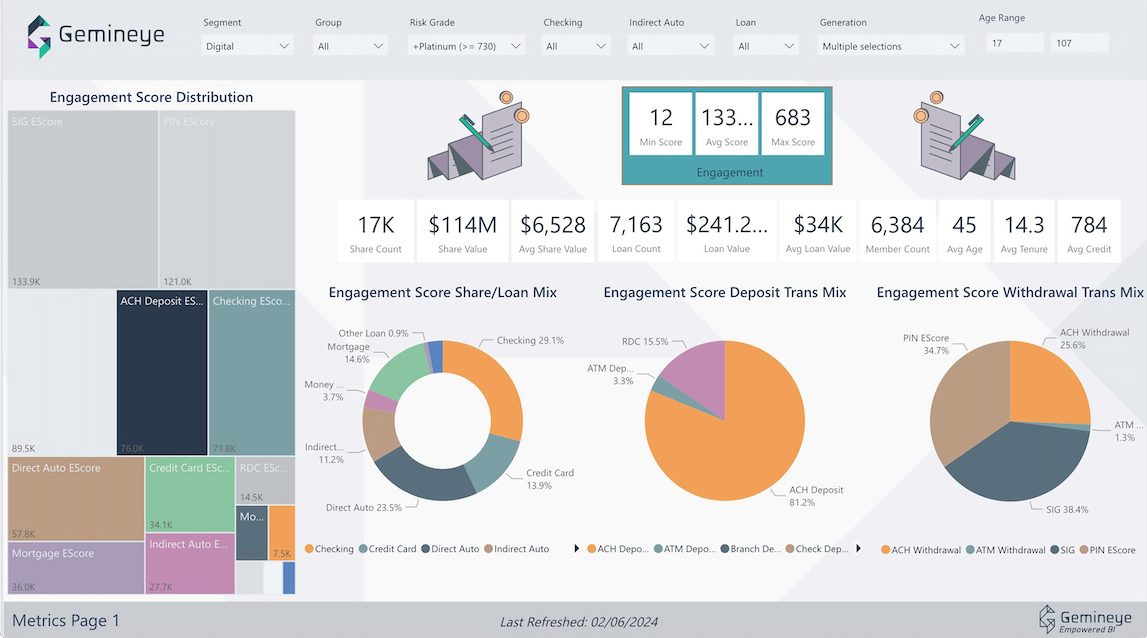
Advanced machine learning and AI insights

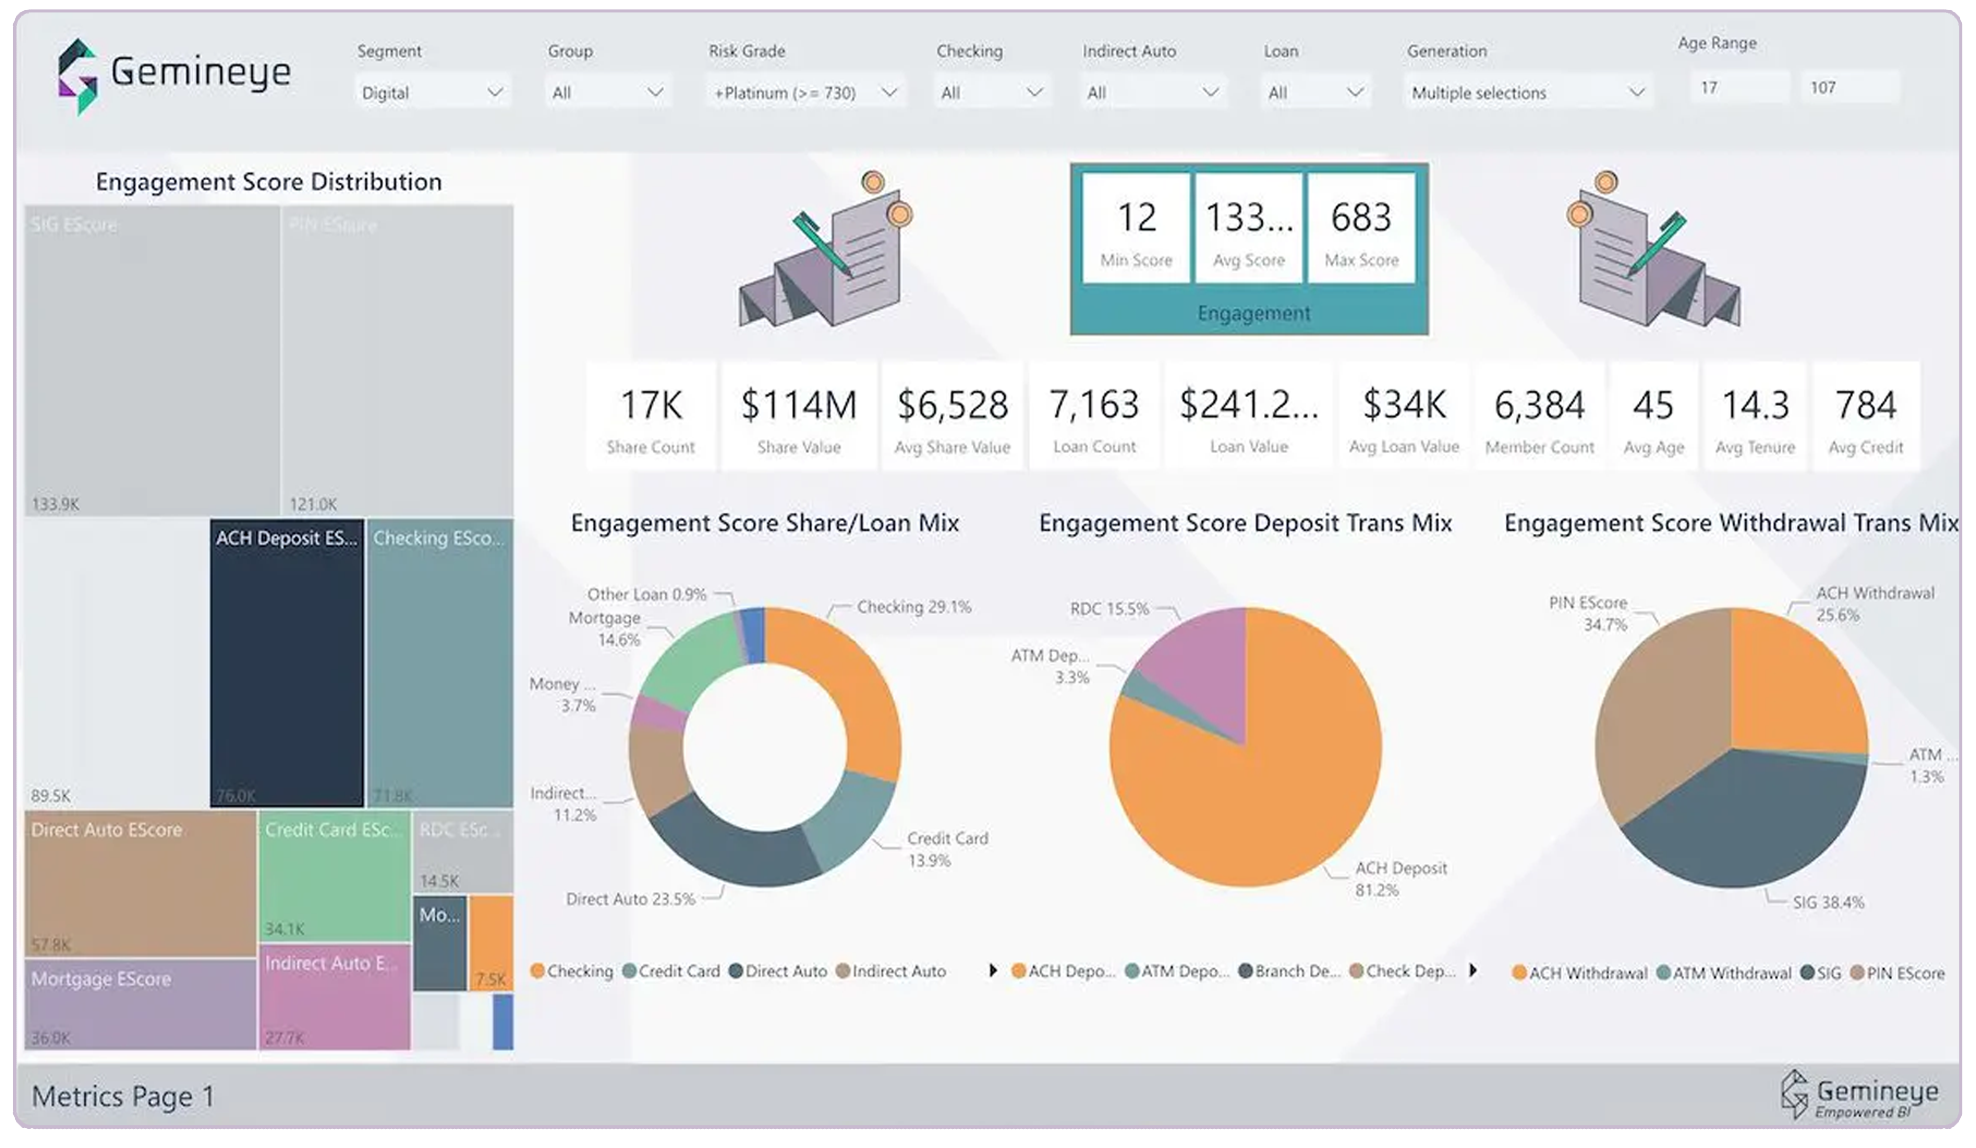
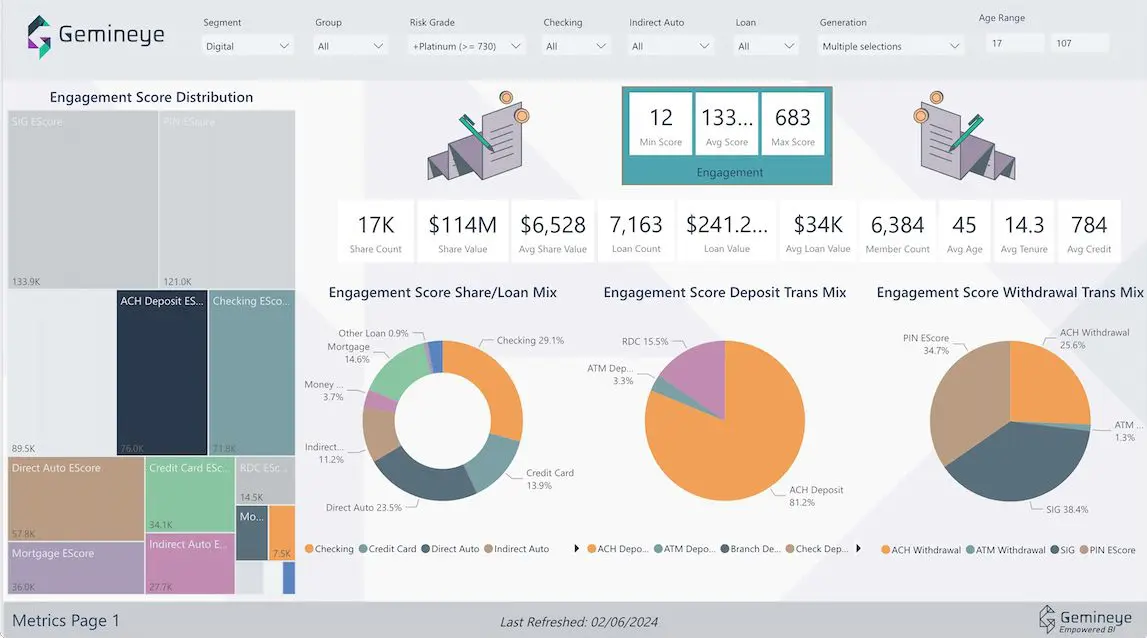
Our customer engagement model, built on a proprietary, cutting-edge data science solution, gives your marketing team Fortune 500 quality insights that can be easily consumed in simple dashboards and leveraged in your list generation and campaigns.
Gemineye Data Lakehouse engagement score distribution report

Advanced machine learning and AI insights

Our customer engagement model, built on a proprietary, cutting-edge data science solution, gives your marketing team Fortune 500 quality insights that can be easily consumed in simple dashboards and leveraged in your list generation and campaigns.
Gemineye Data Lakehouse engagement score distribution report

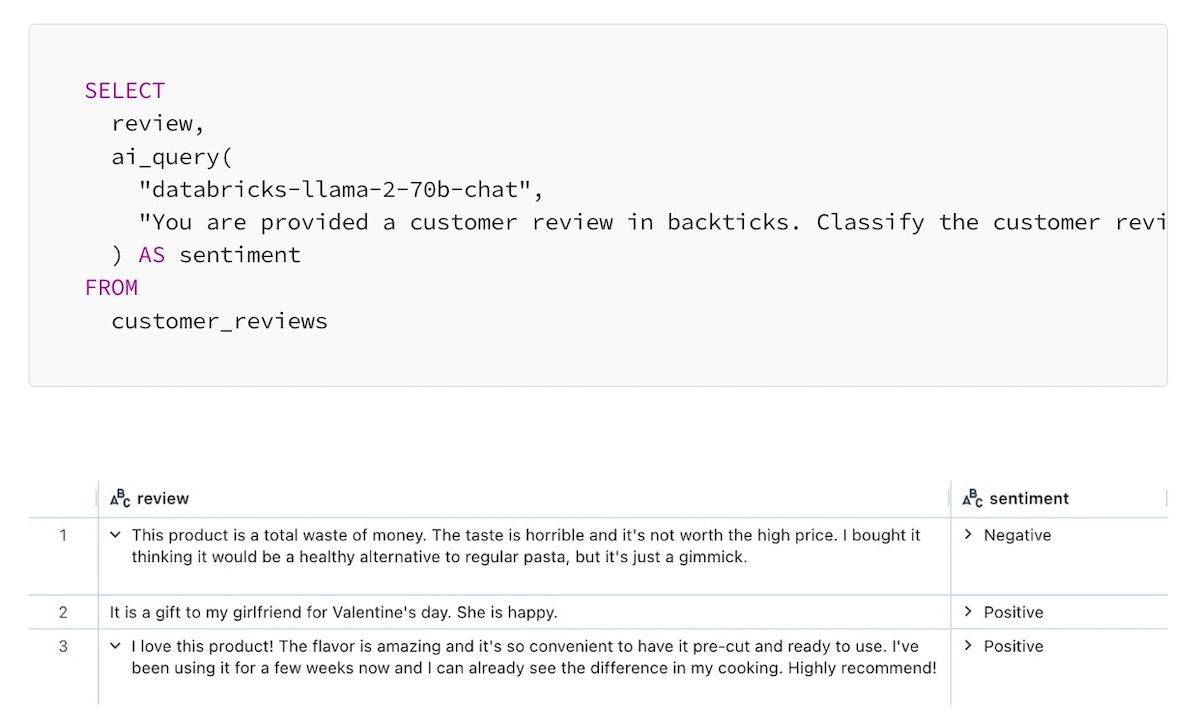
Customer sentiment analysis

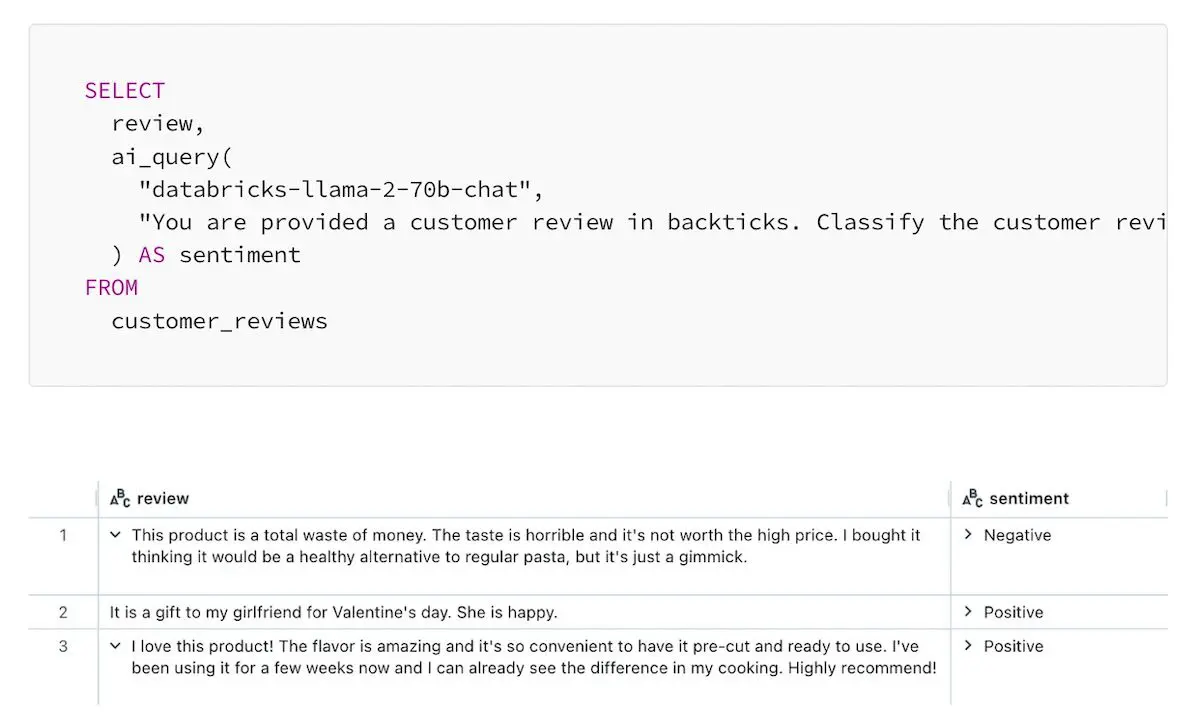
With our embedded generative AI capabilities, advanced insights around customer sentiment analysis, NPS modeling, and other key marketing features become available in a simple, drag-and-drop interface.
Gemineye Data Lakehouse AI assistant screenshot

Customer sentiment analysis

With our embedded generative AI capabilities, advanced insights around customer sentiment analysis, NPS modeling, and other key marketing features become available in a simple, drag-and-drop interface.
Gemineye Data Lakehouse AI assistant screenshot

Hear from Our Clients

Gemineye’s intuitive platform and client-first approach empower our teams to make data-informed decisions that ultimately benefit our members. Better technology means more ways to support the communities we call home.
Tony Beal-Marketing
Tony Beal
Vice President of Business Intelligence at Gesa Credit Union
Purple quote icon
Purple quote icon
Showing Slide 1 of 2

Marketing lists made easy

Gemineye makes those tedious marketing list generation activities simple and seamless. From our thousands of attributes, you can easily filter down based on product and service utilization, demographic attributes, tenure, location, etc. to feed to your marketing campaign tools.
Gemineye Data Lakehouse customer listing report for deposits and loans

Marketing lists made easy

Gemineye makes those tedious marketing list generation activities simple and seamless. From our thousands of attributes, you can easily filter down based on product and service utilization, demographic attributes, tenure, location, etc. to feed to your marketing campaign tools.
Gemineye Data Lakehouse customer listing report for deposits and loans

Advanced machine learning and AI insights

Our customer engagement model, built on a proprietary, cutting-edge data science solution, gives your marketing team Fortune 500 quality insights that can be easily consumed in simple dashboards and leveraged in your list generation and campaigns.
Gemineye Data Lakehouse engagement score distribution report

Advanced machine learning and AI insights

Our customer engagement model, built on a proprietary, cutting-edge data science solution, gives your marketing team Fortune 500 quality insights that can be easily consumed in simple dashboards and leveraged in your list generation and campaigns.
Gemineye Data Lakehouse engagement score distribution report

Customer sentiment analysis

With our embedded generative AI capabilities, advanced insights around customer sentiment analysis, NPS modeling, and other key marketing features become available in a simple, drag-and-drop interface.
Gemineye Data Lakehouse AI assistant screenshot

Customer sentiment analysis

With our embedded generative AI capabilities, advanced insights around customer sentiment analysis, NPS modeling, and other key marketing features become available in a simple, drag-and-drop interface.
Gemineye Data Lakehouse AI assistant screenshot

75 integrations and counting

We currently support over 75 integrations – even the ones that other data analytics providers won’t touch. Our integrations incorporate leading credit union and bank solutions, like consumer loan and mortgage originations, digital banking, CRM / MRM, third-party data vendors, and more.

Gemineye integrations infographic

News and Resources

Ann Ditlow and bento box
Ann Ditlow: Data Analyst at 4Front CU

Welcome to our very first edition of “A Day in the Life of a Data Analyst,” featuring the equally talented and down-to-earth Ann Ditlow, Data Analyst at 4Front CU. Ann ...

gemineye quorum anniversary
Gemineye and Quorum Federal Credit Union Celebrate Five-year Anniversary

The team at Gemineye is excited to announce their five-year anniversary with Quorum Federal Credit Union, a $1.1B organization headquartered in Purchase, NY. Quorum is an entirely-online credit union with ...

gemineye logo and databricks logo with confetti
Gemineye Announces Partnership with Databricks

  Gemineye (formerly The Knowlton Group) has partnered with Databricks, the world’s leading data and AI company. Gemineye’s innovative data analytics architecture, called the Gemineye Data Lakehouse, is run entirely ...

Showing Slide 1 of 4
mint green triangle
Male lifeguard on a tower looking out and holding binoculars.

Why Data Management Is Essential to Member Satisfaction and Trust

As a financial institution—whether a bank or a credit union—you collect data constantly. From personal member information and transaction histories to engagement touchpoints and product performance stats, your internal systems...
READ NOW
Showing Slide 1 of 2

Marketing FAQs

Lorem ipsum dolor sit amet, consectetur adipiscing elit. Lorem ipsum dolor sit amet, consectetur adipiscing elit?

Maecenas nisl sem, lacinia eget justo semper, suscipit tincidunt orci. Maecenas nisl sem, lacinia eget justo semper, suscipit tincidunt orci.

Lorem ipsum dolor sit amet, consectetur adipiscing elit.Lorem ipsum dolor sit amet, consectetur adipiscing elit. Lorem ipsum dolor sit amet, consectetur adipiscing elit.

How Can Marketing Help Your Team?

Access the same technology that Fortune 50 companies use

Know what your customers want today, and tomorrow

A practical and powerful data platform built for modern FIs

Showing Slide 1 of 4
mint green triangle
mint green triangle

News and Resources

How to Build a Data Analytics Roadmap When You Are a Two-Person Data Team

How to Build a Data Analytics Roadmap When You Are a Two-Person Data Team

Most analytics roadmaps are written as if the data team executing them is large, well-funded, and fully staffed. For the typical data team at a credit union or community bank, that is not the reality. The reality is two to four people, a backlog that never empties, and a list of requests that would keep a team three times the size busy. The roadmaps written for big enterprises do not fit, and trying to follow them tends to produce frustration rather than progress. A lean team can still build a real roadmap. It just has to be a different kind of roadmap: one built around sequencing, realistic scope, and the deliberate accumulation of capability over time. The goal is not to do everything. It is to do the right things in the right order, so that each step makes the next one easier. Why a Small Data Team Needs a Roadmap More, Not Less It is tempting to think roadmaps are a luxury for teams with spare capacity. The opposite is true. When resources are scarce, the cost of working on the wrong thing is higher, because there is no slack to absorb the mistake. A roadmap is how a small team protects its limited time from being consumed by whatever request shouted loudest this week. The need is widespread: recent industry research found that while 67 percent of institutions are implementing AI, only 16 percent have an enterprise-wide roadmap to guide it, and 60 percent say talent shortages could impede their strategic priorities. The ambition is nearly universal. The plan to get there, and the people to execute it, often are not. For a two-person team, the roadmap is also a communication tool. It gives leadership a clear view of what is being worked on and why, which reduces the steady pressure of ad hoc requests and helps executives understand that a deliberate sequence is underway rather than a team simply reacting to whatever comes in. The Questions That Turn a Backlog Into a Strategic Plan The most common mistake a lean team makes is starting with tools. A new platform, a new dashboard product, a new visualization layer, chosen before anyone has defined what questions the institution actually needs answered. This gets the order backward and almost always wastes scarce resources. A better starting point is a focused list of the business questions that matter most. Which members or customers are most likely to leave? Where is loan portfolio risk concentrating? Which branches are over or under their service capacity? Each of these is a question with a clear owner who cares about the answer, and each maps to a specific analytics deliverable. Building the roadmap from the questions ensures every item on it has a defined purpose and a stakeholder waiting for the result, which is exactly what a resource-constrained team needs to justify its time. How Small Data Teams Get Faster With Every Project Once the questions are defined, the sequencing principle for a small team is not to start with the most ambitious project. It is to start with the work that delivers visible impact quickly and builds reusable foundations for what comes next. A first project that cleans and connects a key data source does double duty: it answers an immediate question and it makes every future project that touches that data faster. This is the core advantage a small team can engineer for itself. By sequencing so that early work creates reusable assets, like connected data sources, consistent definitions, and a governed environment, the team gets faster with each project rather than starting from scratch every time. The roadmap compounds. What feels slow at the start accelerates, because the foundation laid early keeps paying off. Keep Your Roadmap Alive When the Requests Keep Coming The single greatest threat to a small team’s roadmap is the backlog. Every week brings new requests, each reasonable on its own, and each one is a small pull away from the planned work. Without a deliberate defense, the roadmap quietly dissolves into reactive request-fulfillment, and the team ends the year having stayed busy without having advanced. Protecting the roadmap does not mean refusing requests. It means having a structure that absorbs routine requests without derailing planned work. The most effective structure is self-service: when stakeholders can answer their own routine questions without going through the data team, the volume of interruptions drops, and the roadmap survives. Building that self-service capability is itself a high-value roadmap item, because it directly buys back the team’s time. From a Two-Person Team to a Mature Analytics Program A lean team cannot stand up a complete, mature analytics function in a single push. What it can do is build capability in layers, where each layer is achievable with current resources and sets up the next. The first layer might be connecting core data sources and establishing trustworthy definitions. The next might be self-service reporting for the most common requests. After that, predictive work becomes possible, because the foundation to support it finally exists. This layered approach is what makes an ambitious end state reachable for a small team. Nobody gets from a two-person reactive function to a mature analytics program in one leap. But a roadmap that sequences achievable layers, each building on the last, gets there over time without ever requiring the team to take on more than it can handle at once. Give Your Lean Team a Foundation That Scales The roadmaps that work for small data teams all depend on a foundation that does the heavy lifting of connecting and governing data, so the team’s limited time goes toward analysis rather than maintenance. Gemineye’s Data Analytics platform is built for exactly this. It connects more than 75 data sources into one governed environment, maintains consistent definitions, and enables self-service access, so a two-person team can build reusable foundations early and accelerate with every project that follows. See how Gemineye helps lean data teams at credit unions and community banks build ...

Financial Plus Credit Union and Gemineye partnership

Gemineye & Financial Plus CU Team Up to Bring Reporting Best Practices to Student Program

Sandwich, Mass (September 11th, 2026) – If you know credit unions, you know how often they prioritize community impact, and analytics provider Gemineye is thrilled to be a part of these efforts by partnering with their client $1.6B, Michigan-based Financial Plus Credit Union (FPCU) to deliver an incredible experience for the next generation of technology professionals. As part of FPCU’s strategic partnership with Kettering University, Kettering Co-op students have the opportunity to gain hands-on, real-world experience while working alongside FPCU’s team. Unlike a traditional internship, Kettering’s Co-op program is an immersive part of the students’ education, combining alternating academic and full-time paid Co-op terms throughout their entire time at the university. FPCU’s Co-op students work alongside professionals, gaining meaningful experience in their fields while contributing to projects that have a real impact on the organization. In the Spring 2026 semester, FPCU and Gemineye collaborated to take that experience to the next level. Maggie Chopp, Director of Business Development at Gemineye said, “Credit unions are often incredible doors to opportunity for young professionals to grow in a hands-on environment – I know from my own experience starting out in credit unions. FPCU’s ongoing commitment to bringing the best educational opportunities possible to the Kettering University Co-Op students is great example of the educational impact CUs can make. And by partnering with Gemineye, they were able to further develop these valuable STEM experiences.” While the Co-op experience was designed to help the students grow, the benefits extended to FPCU also, as Gemineye was able to help FPCU improve their reporting infrastructure concurrently. The updated dashboard gave the IT team a more effective tool for understanding and managing its workload. Meredith Baaki, Director of Innovation & Product Management at FPCU explained, “Great dashboards don’t answer every question. They answer the right questions. Because Gemineye took the time to clearly define our goals and the decisions we needed to support, we were able to transform raw ticket data into meaningful insights. The dashboard gives us a clear view of team capacity, workload, and demand, creating alignment across the organization and helping us make better decisions about where to focus next.” As a credit union and community bank-specific analytics provider, Gemineye enthusiastically supports the credit union mission of people helping people. This partnership with FPCU and the Kettering University students was a natural fit for both teams to shine. “Credit union leaders often have similar origin stories as students, interns or entry level positions – so I think it’s easy for our audience to appreciate the emphasis we put on education” explains Gemineye’s Maggie Chopp. “We honored to be a part of the ‘people helping people’ philosophy.” To read FPCU’s full case study, including before-and-after dashboards, click here. About Financial Plus Credit Union Since 1952, Financial Plus has been putting today’s needs and tomorrow’s dreams all within reach. Owned by over 83,000 members with more than $1.7 billion in assets, the credit union provides a full range of modern, easily accessible banking products and services to all throughout the state of Michigan. For more information, visit www.myfpcu.com or call (800) 748-0451. See Gemineye’s Full Suite of Solutions Interested in learning how the Gemineye Data Lakehouse can support your dashboard and reporting needs like Financial Plus CU? Browse the solutions we solve and business teams we help.

How Credit Unions and Community Banks Are Using Data to Optimize Branch Performance

How Credit Unions and Community Banks Are Using Data to Optimize Branch Performance

Two branches, 20 minutes apart, same products, similar size. One is thriving. The other is quietly slipping. The numbers that explain why are sitting in 4 different systems, and nobody has put them side by side. This is the situation at most credit unions and community banks. The branch network generates an enormous amount of data every day, on foot traffic, staffing, new accounts, product mix, service times, and member satisfaction. But that data lives in separate systems, gets compiled by hand once a month if at all, and rarely arrives in time or in a form that helps a leader actually manage a branch. The result is that branch decisions get made on instinct and anecdote, when the evidence to make them well already exists. The institutions pulling ahead are the ones that have stopped guessing. They have connected their branch data, made it visible, and turned it into a tool for managing performance branch by branch. Here is what that looks like in practice. Spot a Struggling Branch Before the Quarter Ends Go back to those two branches. The one that is slipping did not fail overnight. The early signals (a slow decline in new accounts, longer wait times, a drop in a key product line) were present for months. They simply were not visible to anyone in a position to act, because the data that showed them was scattered and stale. When branch data is connected and current, those signals surface while there is still time to respond. A leader can see that one location’s new-account growth has flattened relative to the others, look into why, and intervene, rather than discovering the problem in a quarterly report when three months of ground has already been lost. The point is not the dashboard itself. It is the shift from finding out too late to seeing it as it happens. Match Staffing to What Each Branch Actually Needs Branch staffing is one of the largest controllable costs a credit union carries, and human resource expenses are typically a credit union’s single largest operating cost, as Callahan & Associates notes in its performance benchmarking guidance. Yet staffing decisions are often made on rough averages rather than on what each branch actually experiences. One location is overstaffed during quiet midweek mornings while another has members waiting in line every Friday afternoon. Branch-level data on traffic patterns, transaction volume, and service times turns staffing from a guess into a plan. Leaders can align hours and personnel to the real rhythm of each location, reducing the cost of idle capacity at one branch and the service failures of an understaffed one. The same data reveals which branches are genuinely productive on a members-per-employee basis and which are carrying more cost than their activity justifies. See Which Branches Are Growing Relationships, Not Just Transactions A branch that processes a high volume of transactions is busy. That is not the same as a branch that is deepening member relationships. The difference shows up in product penetration: how many products the average member at a given branch actually uses. A branch can look active while quietly failing to grow the relationships that drive long-term value. When leaders can compare product penetration and onboarding success across branches, the picture sharpens considerably. A location with strong new-member growth but weak product adoption has a clear, addressable opportunity. A branch where new members are activating multiple products is doing something worth understanding and replicating. These are the granular, specific insights that turn a vague sense of how a branch is doing into a concrete plan for improving it. Replace Anecdote With Evidence in Branch Decisions The deeper shift is cultural. When branch data is hard to get, decisions default to opinion, the loudest voice, the most recent complaint, or a manager’s gut feeling. When the data is visible and trusted, the conversation changes. This is exactly the shift P1FCU in Idaho made by using Gemineye’s analytics platform to generate insights on branch activity. The institution moved away from anecdotal evidence, opinion, and reliance on spreadsheets, and toward decisions grounded in clear operational data. That is the real value of branch analytics: not prettier reports, but better decisions, made with confidence, by people who can finally see what is happening across their network. Give Every Branch the Data to Perform Optimizing branch performance depends on bringing scattered branch data together and making it visible to the people who run the network. Gemineye’s Operations solution connects the systems behind your branches and delivers detailed daily reporting, so leaders can see traffic and staffing patterns, product penetration, and onboarding success across every location, not once a month, but as it happens. The two branches twenty minutes apart stop being a mystery. See how Gemineye helps credit unions and community banks turn branch data into branch performance. One small consistency note: the opening italic line uses “20 minutes” and “4 different systems” (numerals), while the closing line says “twenty minutes apart” (spelled out). Worth standardizing to whichever style the client prefers before publishing.

Showing Slide 1 of 4

Ready to finally have control over your data analytics experience?

We offer complimentary consultations – never pushy, always honest.