Finance

A comprehensive financial reporting data solution for finance teams who won’t settle.
test

Integrations Include:

It seems we can't find what you're looking for.

Deliver long-awaited autonomy and flexibility to your finance team

Reports and Visualizations
AI Insights
Deep Financial Expertise
Transparent Data Dictionary

Profitability at the most granular level

Don’t assume profitability based on “averages of averages”. Connect to your data at the most granular level including interchange on transactions and interest spreads on individual products. 

Related

CUSTOMERS INSIGHTS

Powerful ML/Al-driven engagement,
segmentation, and predicitive actions

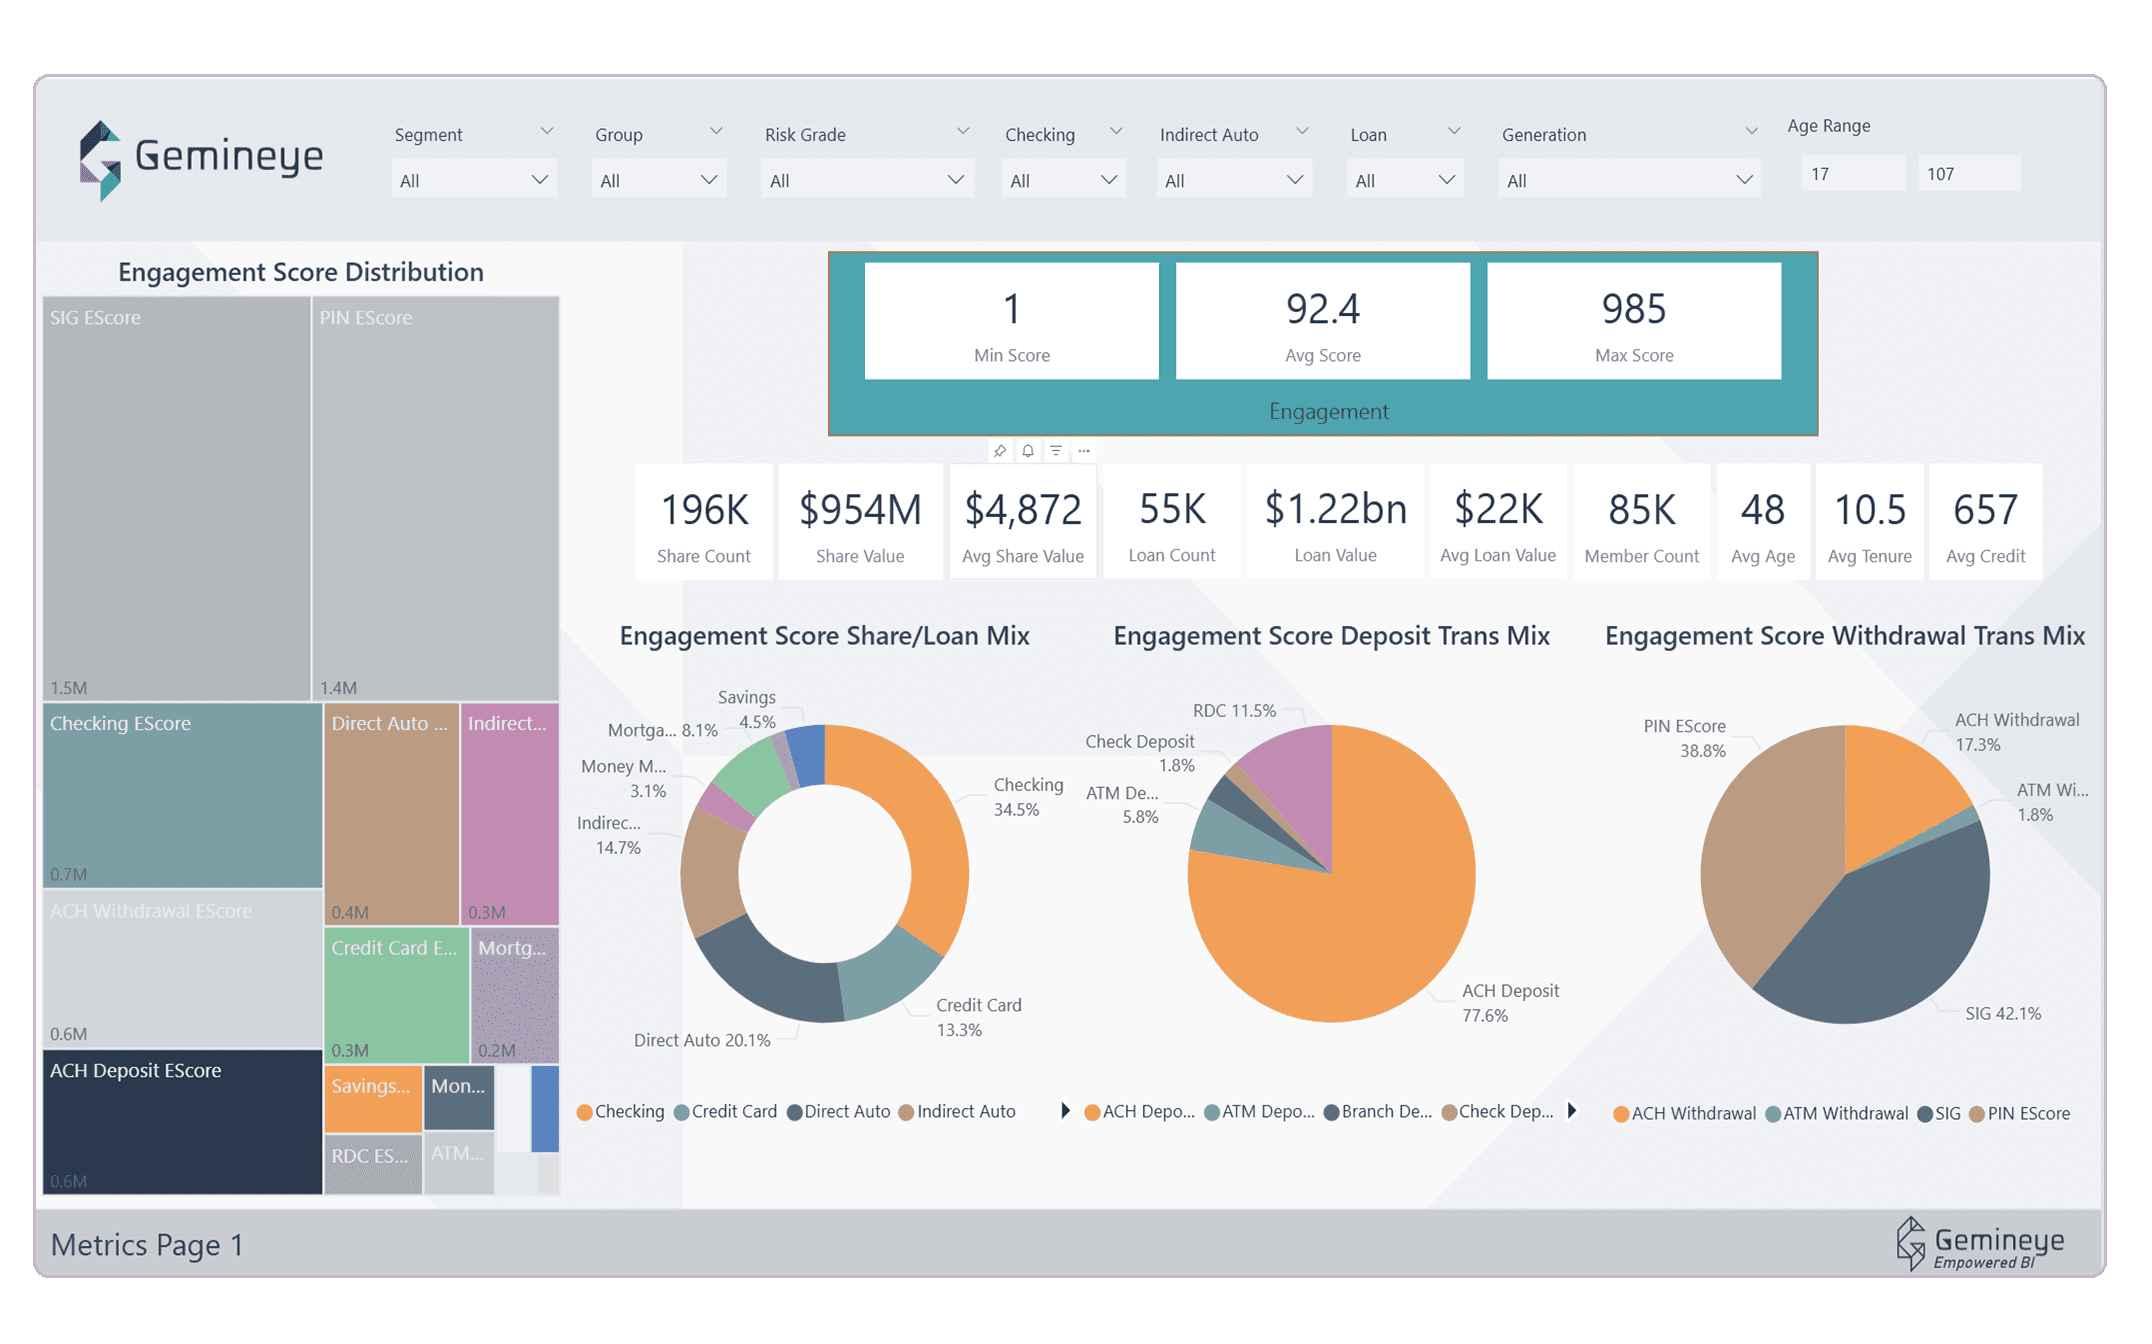
Gemineye data lakehouse metrics summary
Definition Customization
Gemineye data lakehouse metrics summary

Definition Customization

Definition Customization documents fully integrated into the solution and design to ensure your team knows exactly how all fields move from source to the data warehouse to the dashboards and reports.

Advanced Lakehouse Monitoring

Advanced Lakehouse Monitoring

Advanced Lakehouse Monitoring documents fully integrated into the solution and design to ensure your team knows exactly how all fields move from source to the data warehouse to the dashboards and reports.
Gemineye data lakehouse metrics summary

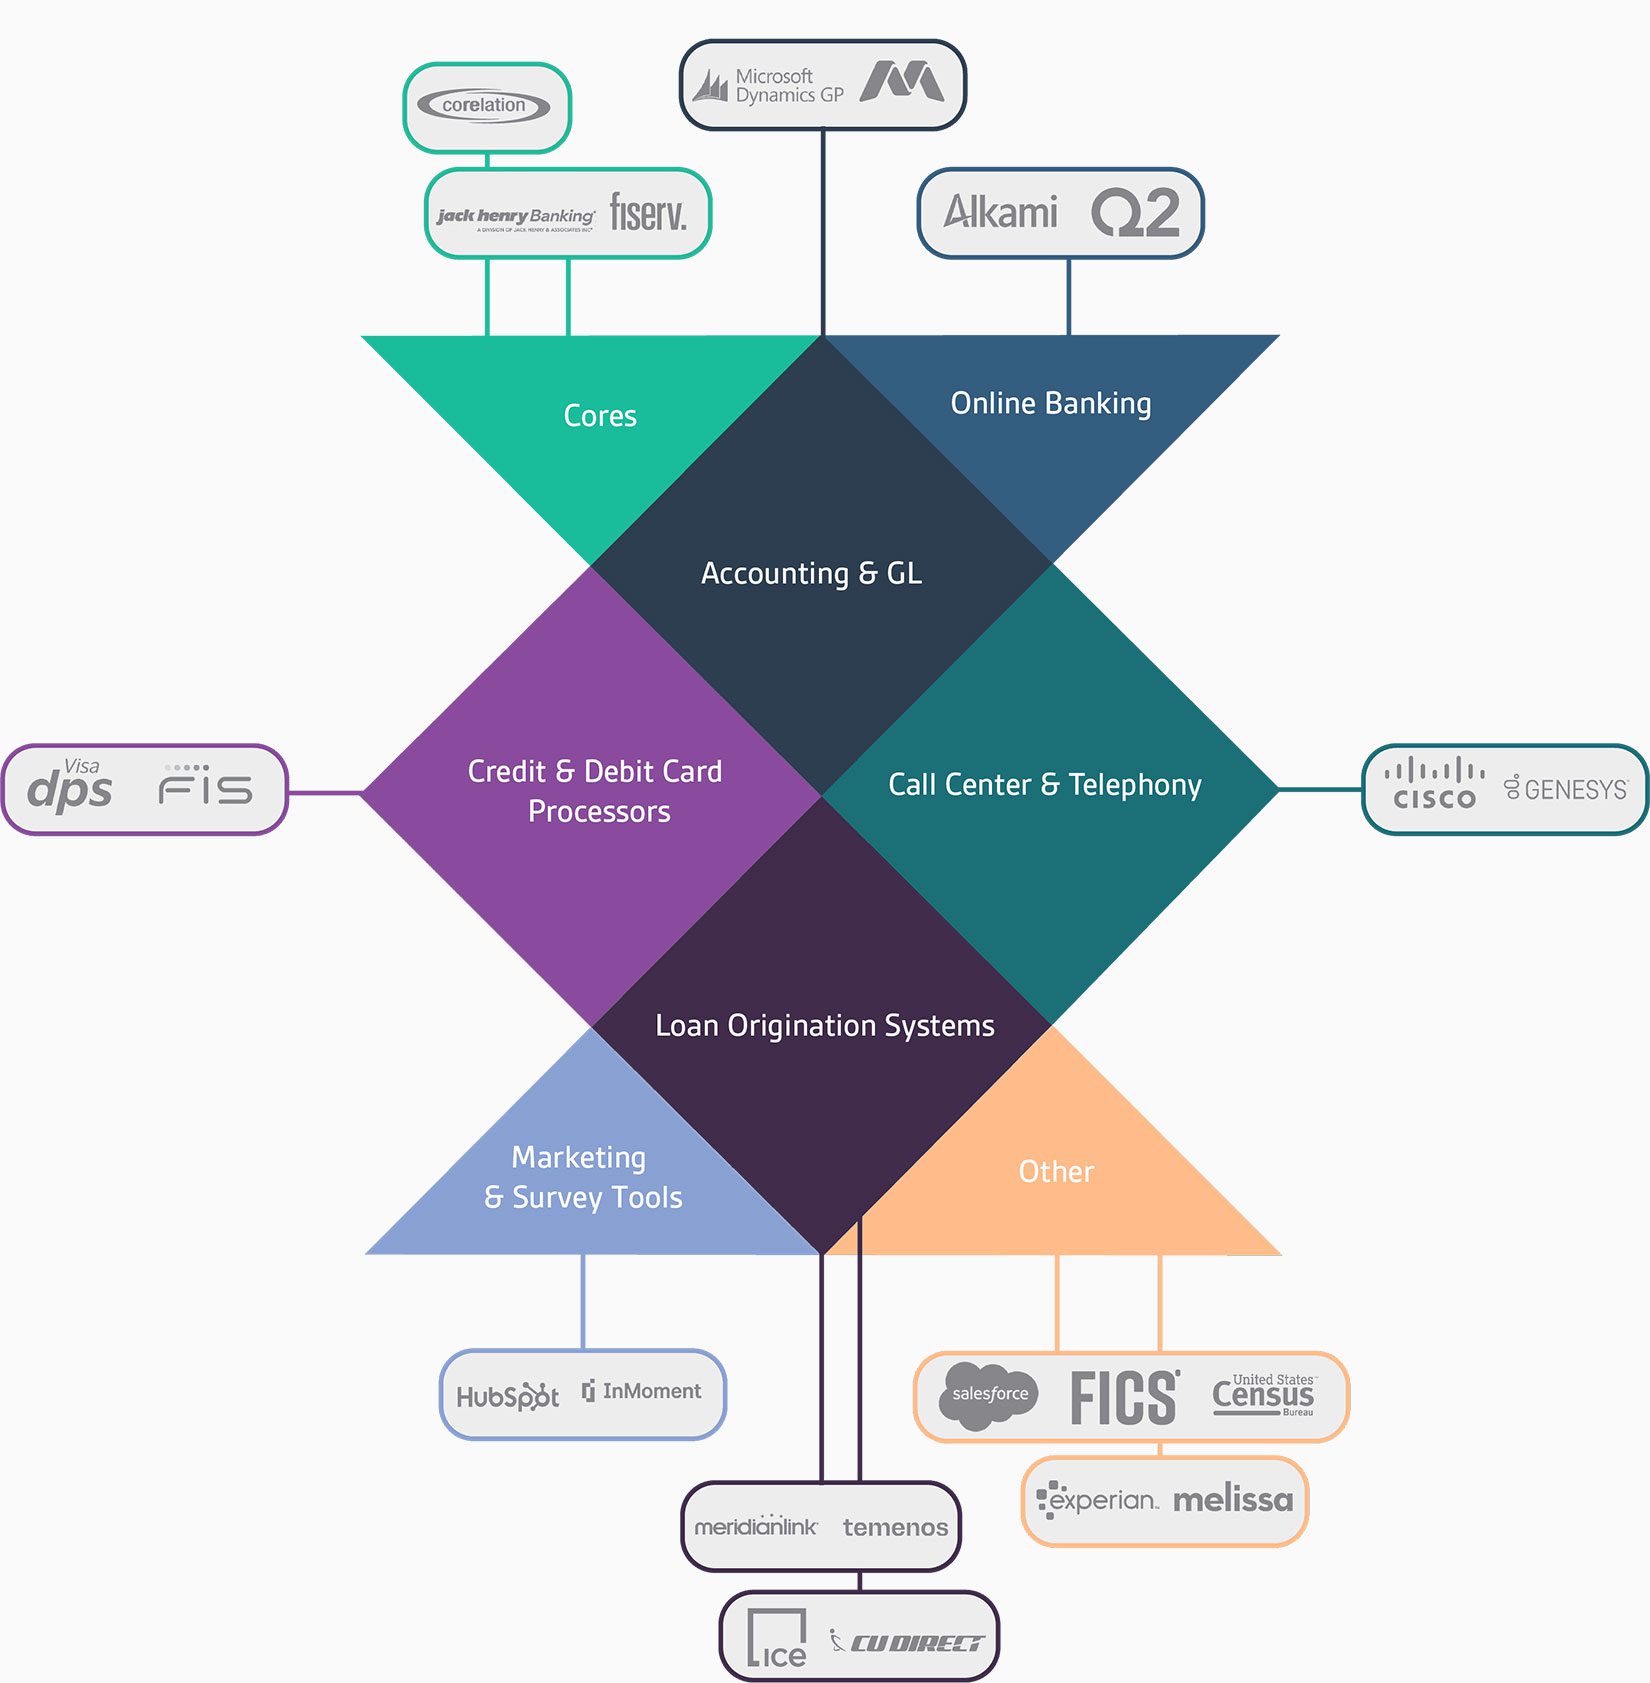
75 integrations and counting

We currently support over 75 integrations – even the ones that other data analytics providers won’t touch. Our integrations incorporate leading credit union and bank solutions, like consumer loan and mortgage originations, digital banking, CRM / MRM, third-party data vendors, and more.

Gemineye integrations infographic

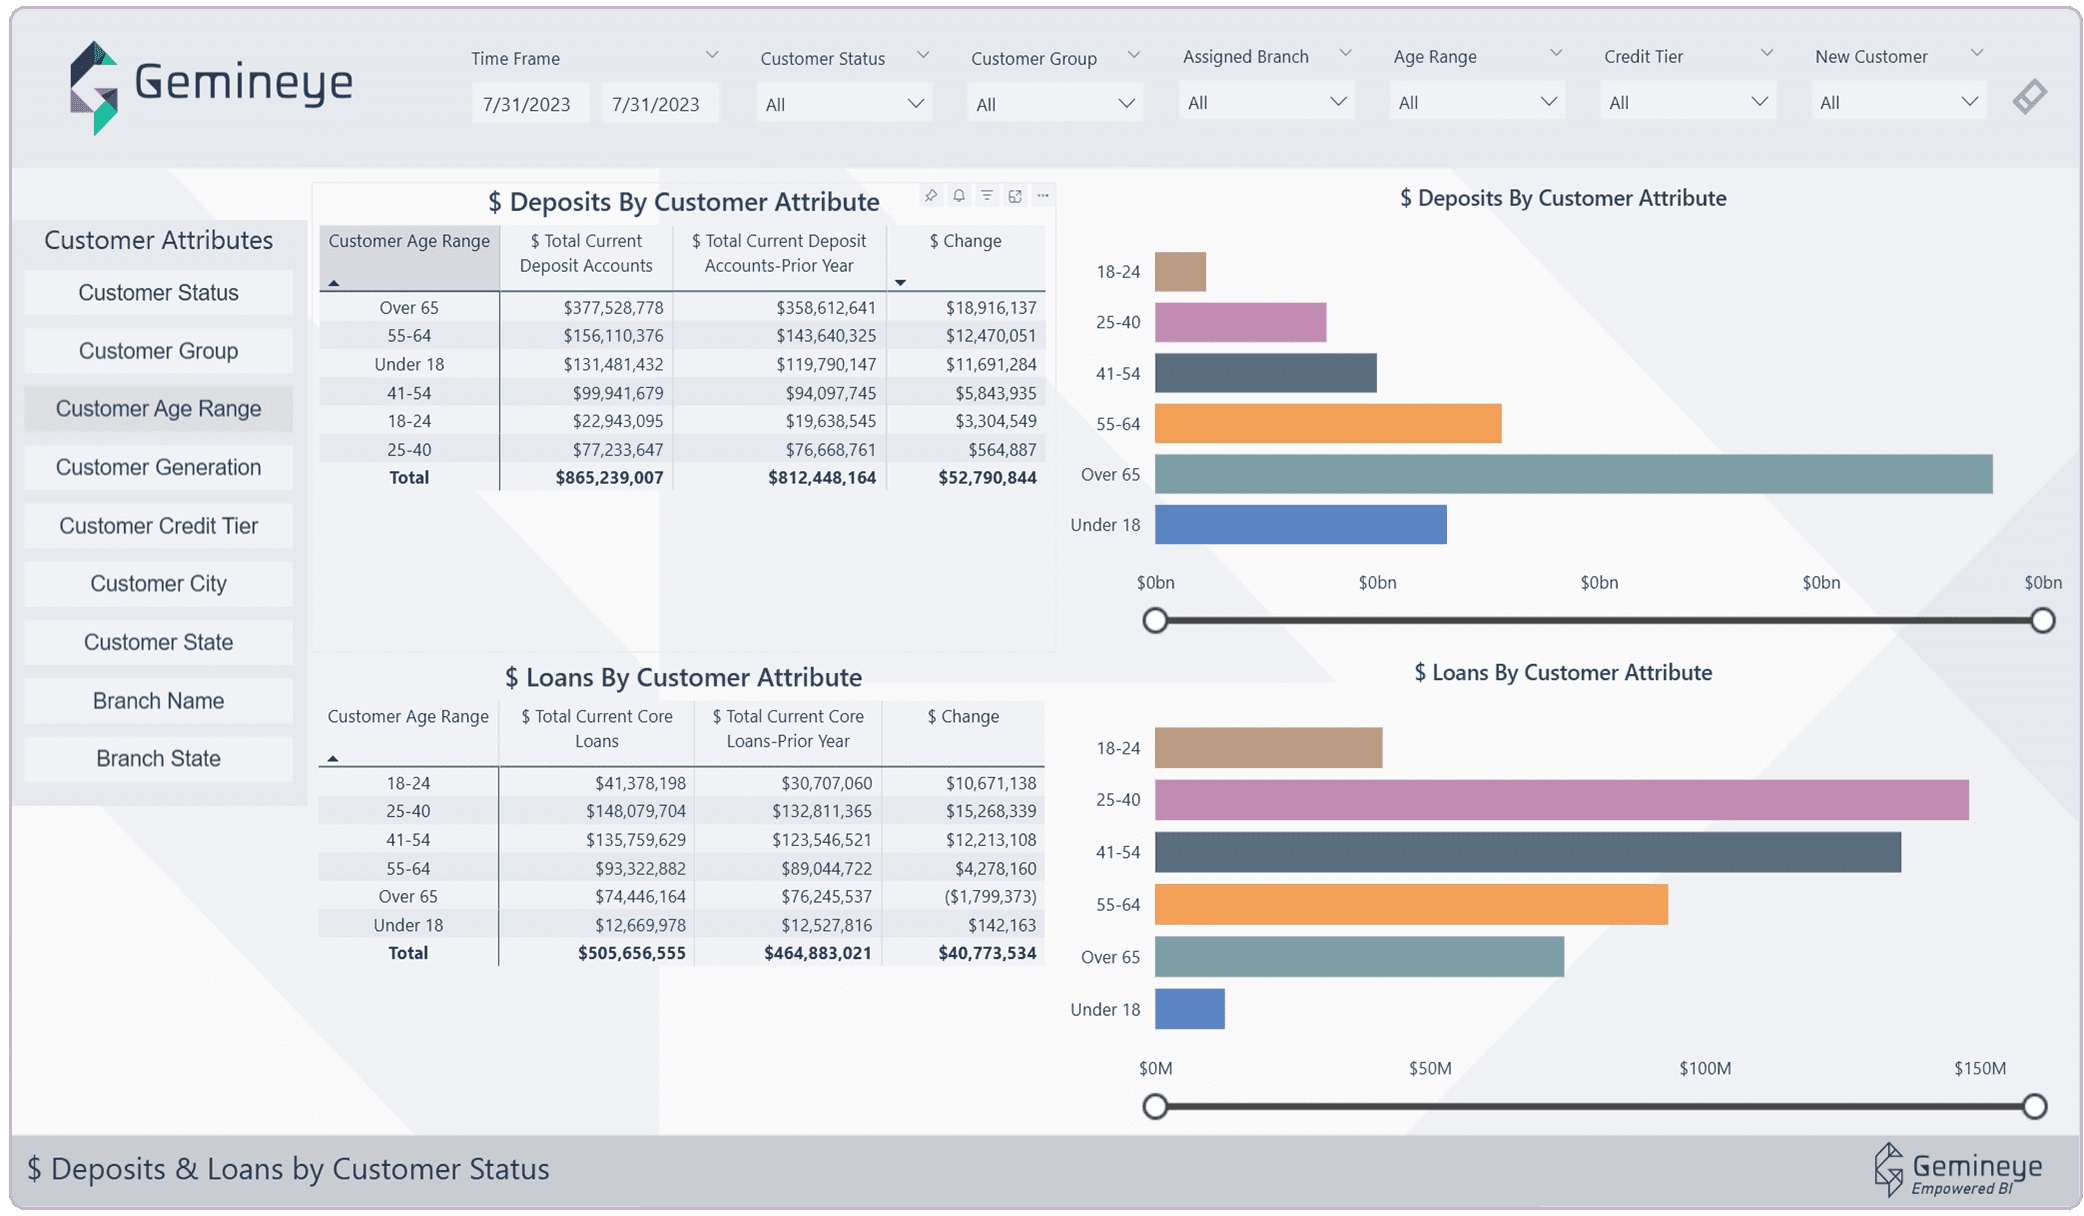
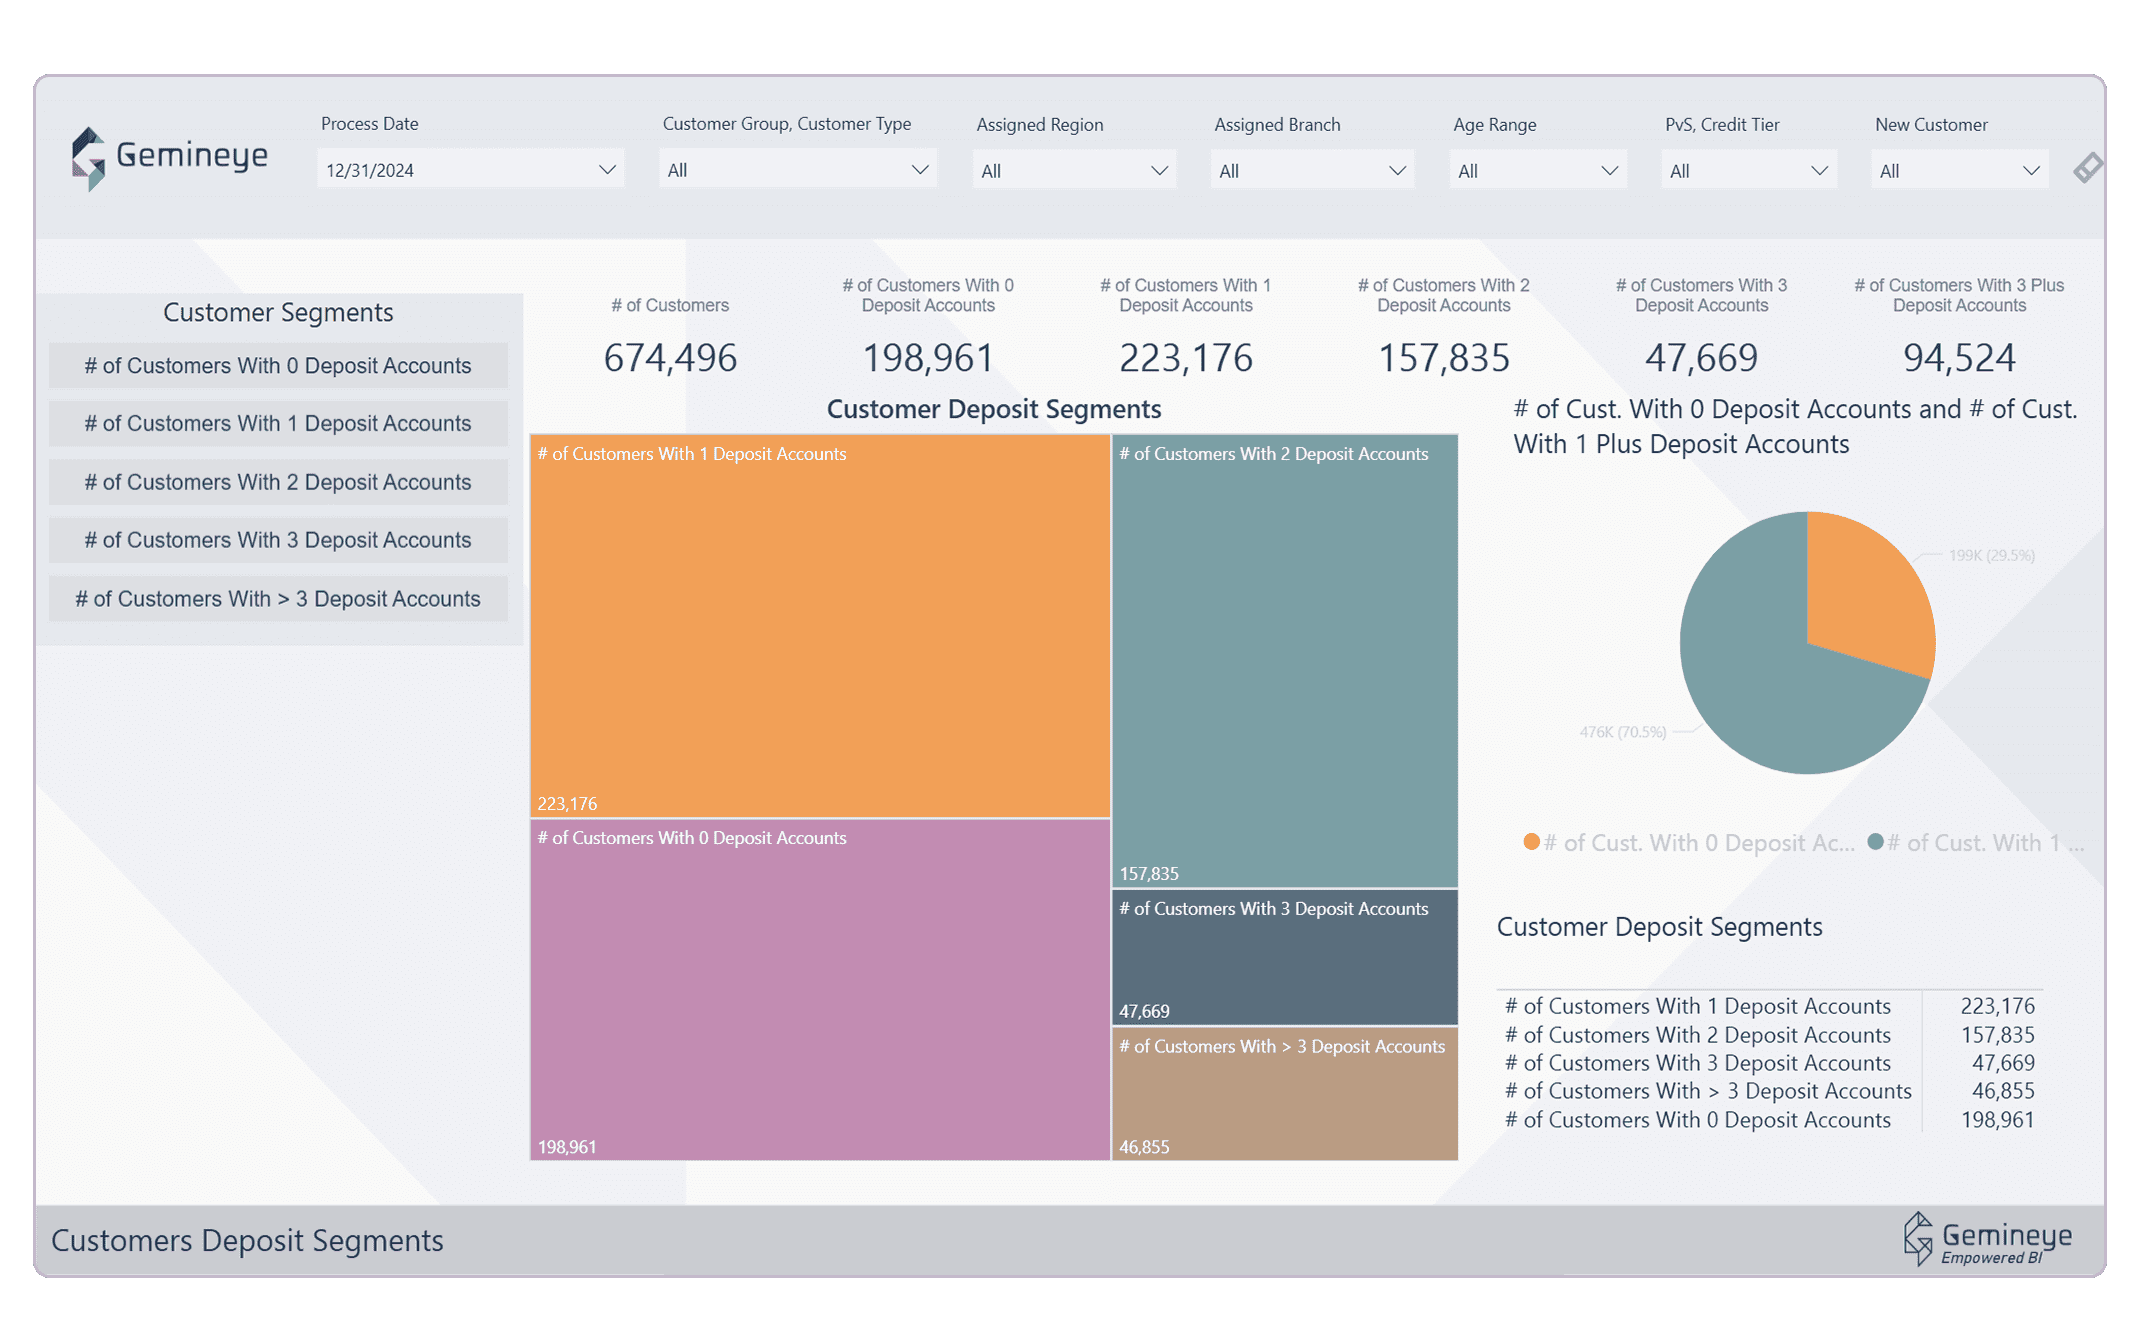
Over 200 reports and visualizations

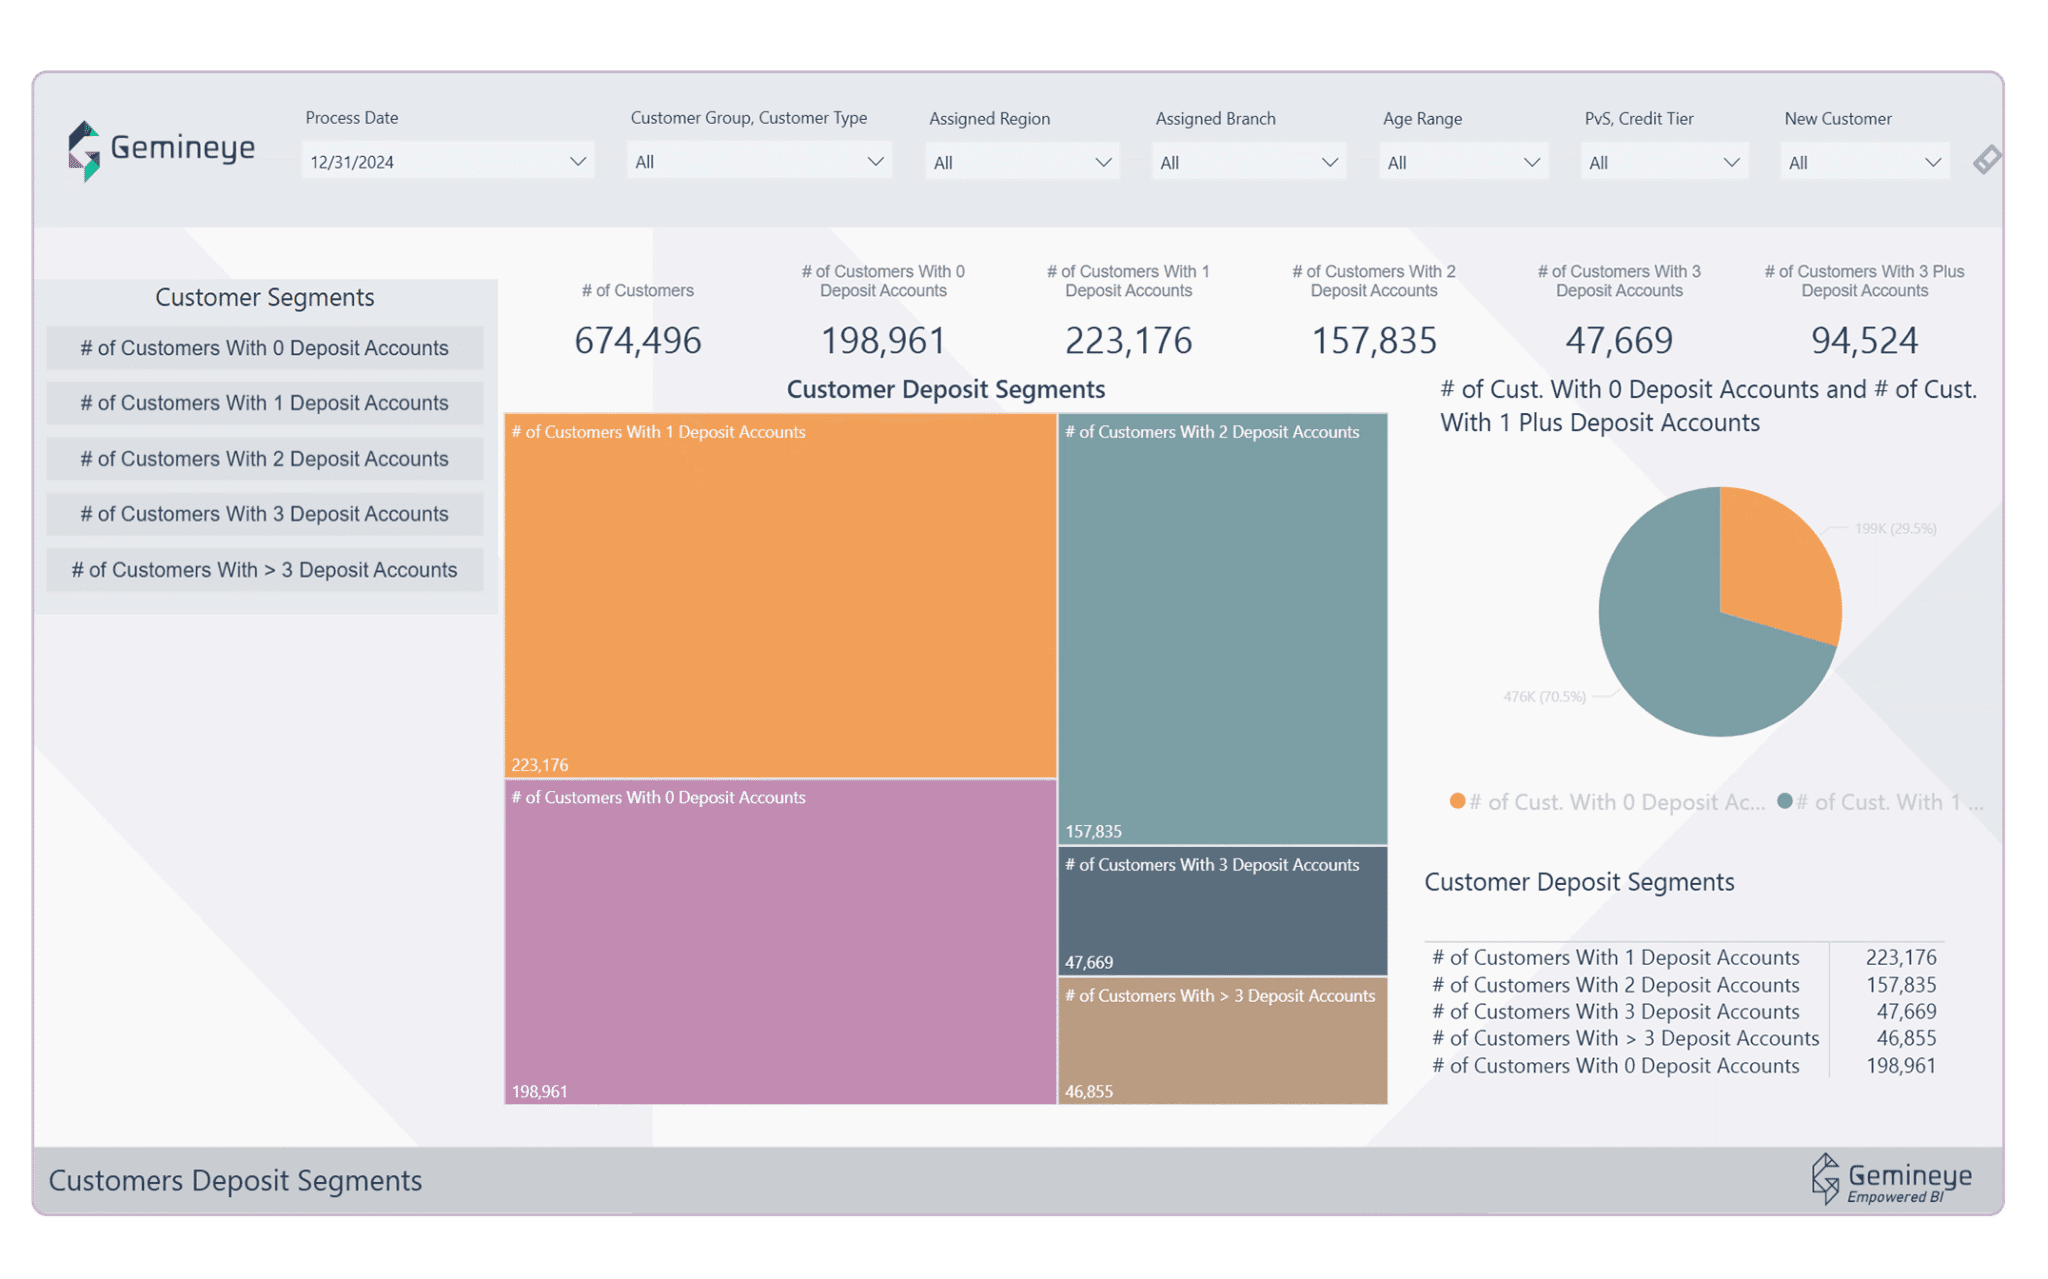
Finance teams will be hard pressed to request a financial report that doesn’t already exist within the Gemineye Data Lakehouse. Hundreds of reports and visualizations means there really is something for everyone, no matter how unique your ask.
Gemineye data lakehouse deposit segments

Over 200 reports and visualizations

Finance teams will be hard pressed to request a financial report that doesn’t already exist within the Gemineye Data Lakehouse. Hundreds of reports and visualizations means there really is something for everyone, no matter how unique your ask.
Gemineye data lakehouse deposit segments

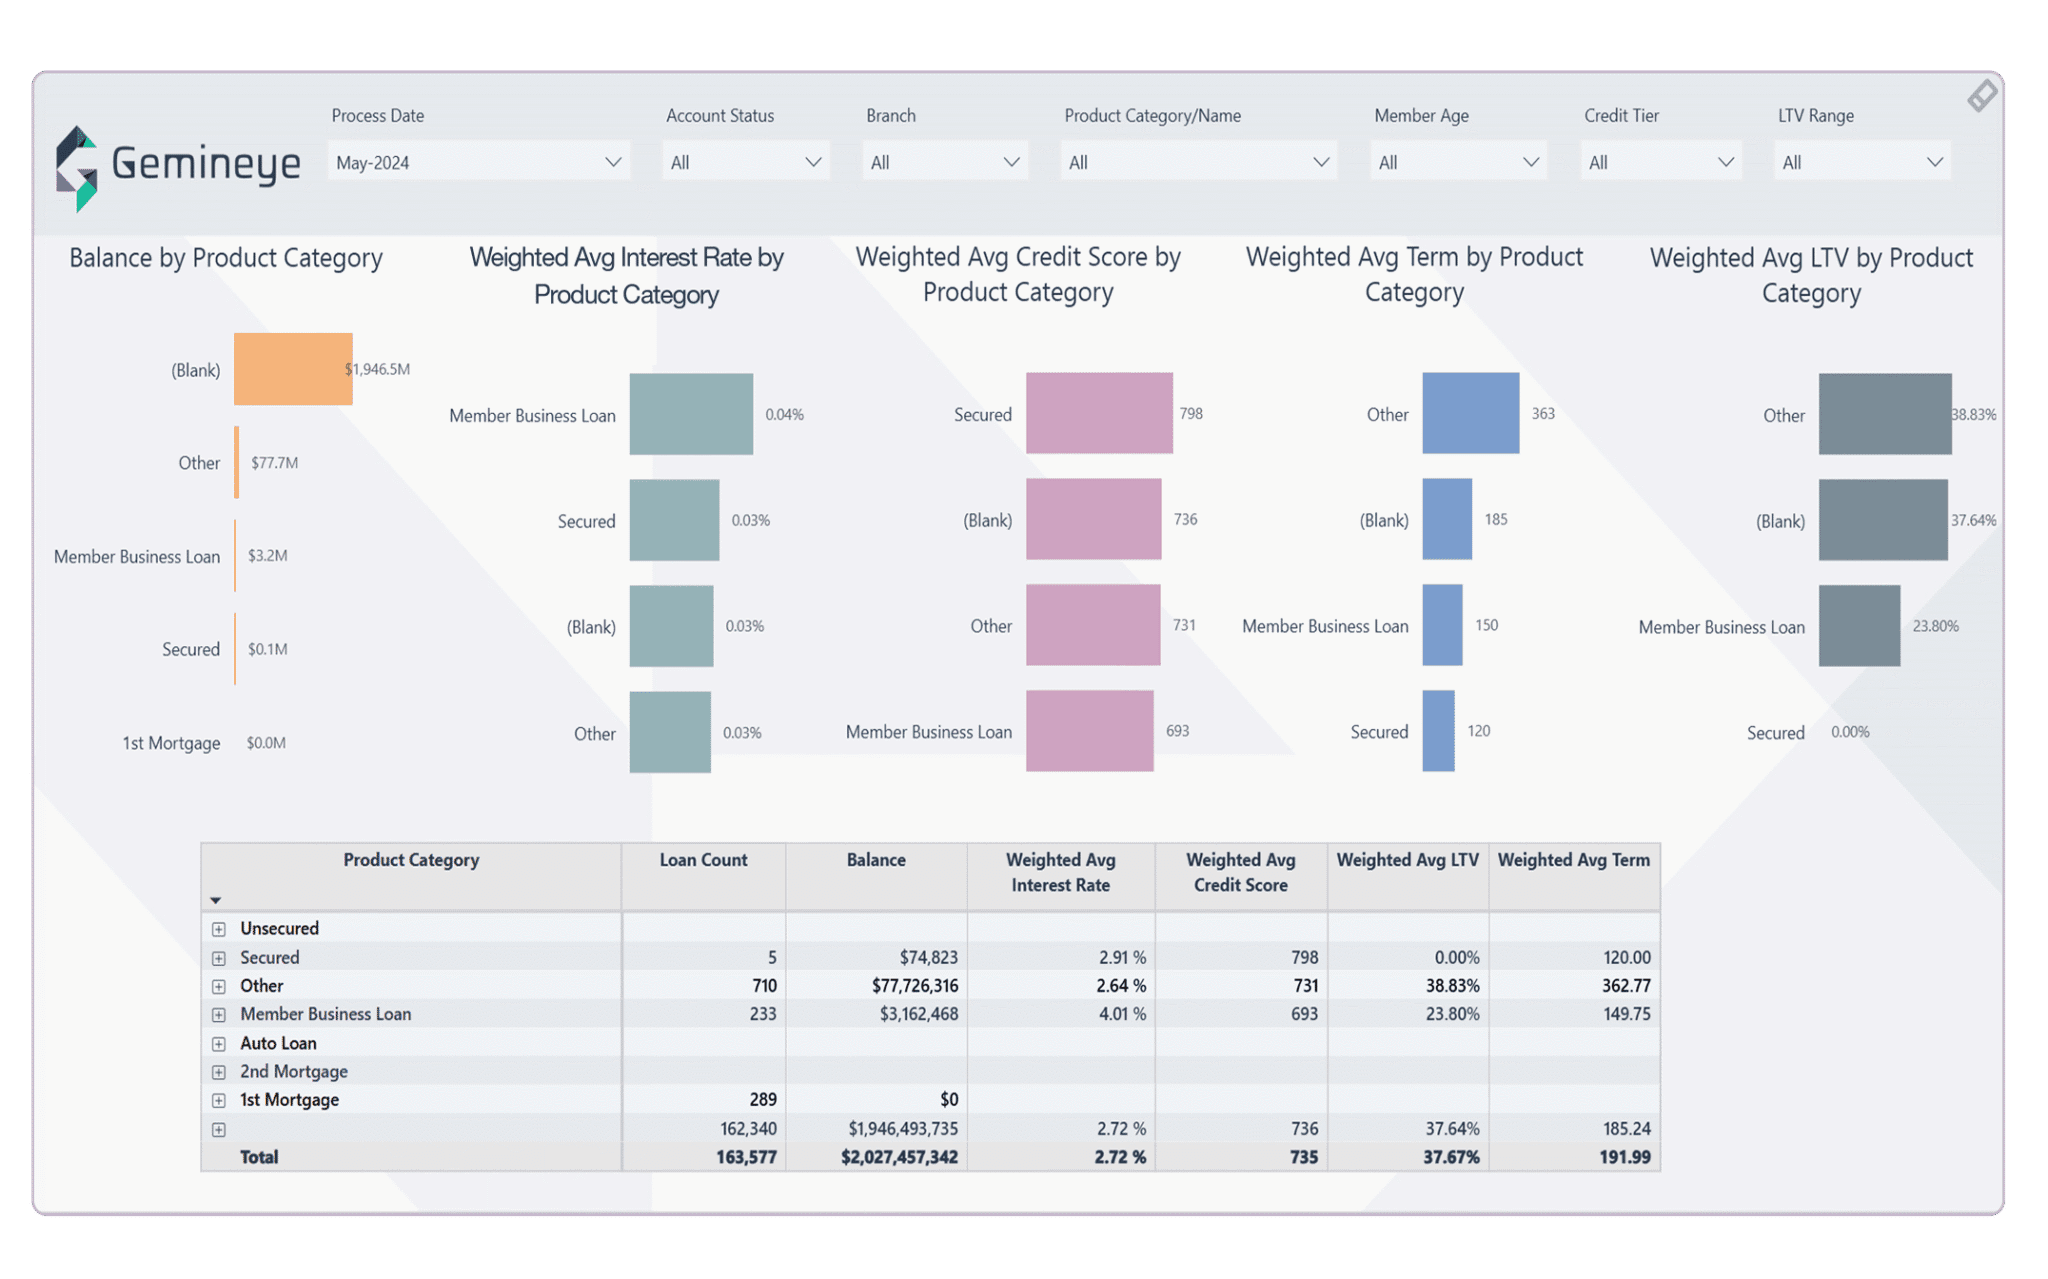
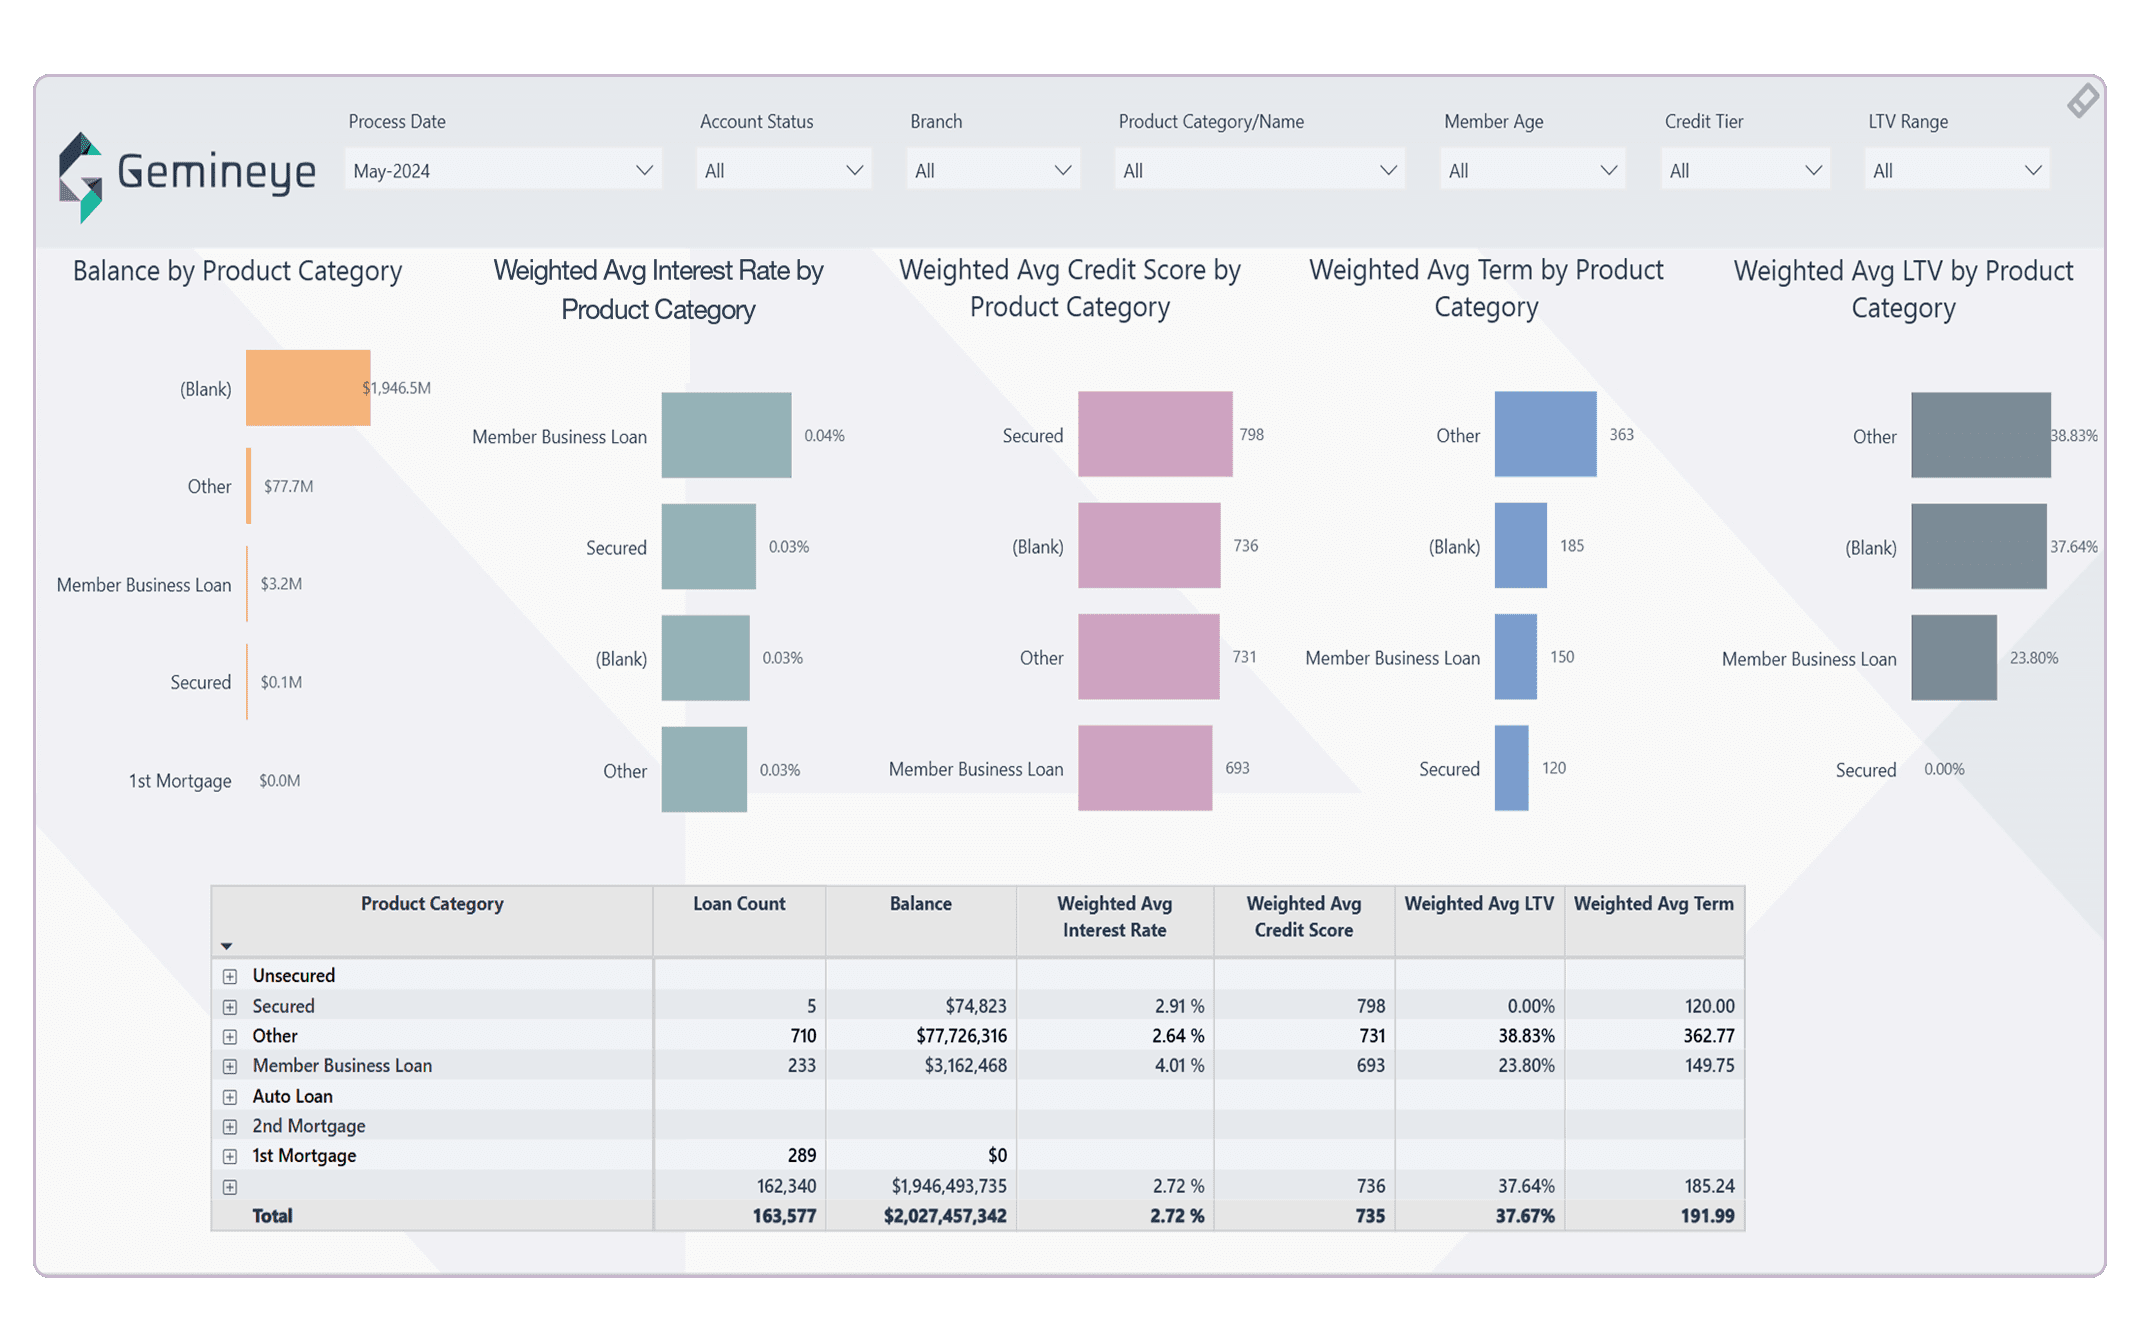
Advanced machine learning and AI insights

Don’t setting for second best. Your finance team can use the same AI tools that Fortune 500 companies use, providing cutting-edge insights and dashboards.
Gemineye Data Lakehouse screenshot Product Category

Advanced machine learning and AI insights

Don’t setting for second best. Your finance team can use the same AI tools that Fortune 500 companies use, providing cutting-edge insights and dashboards.
Gemineye Data Lakehouse screenshot Product Category

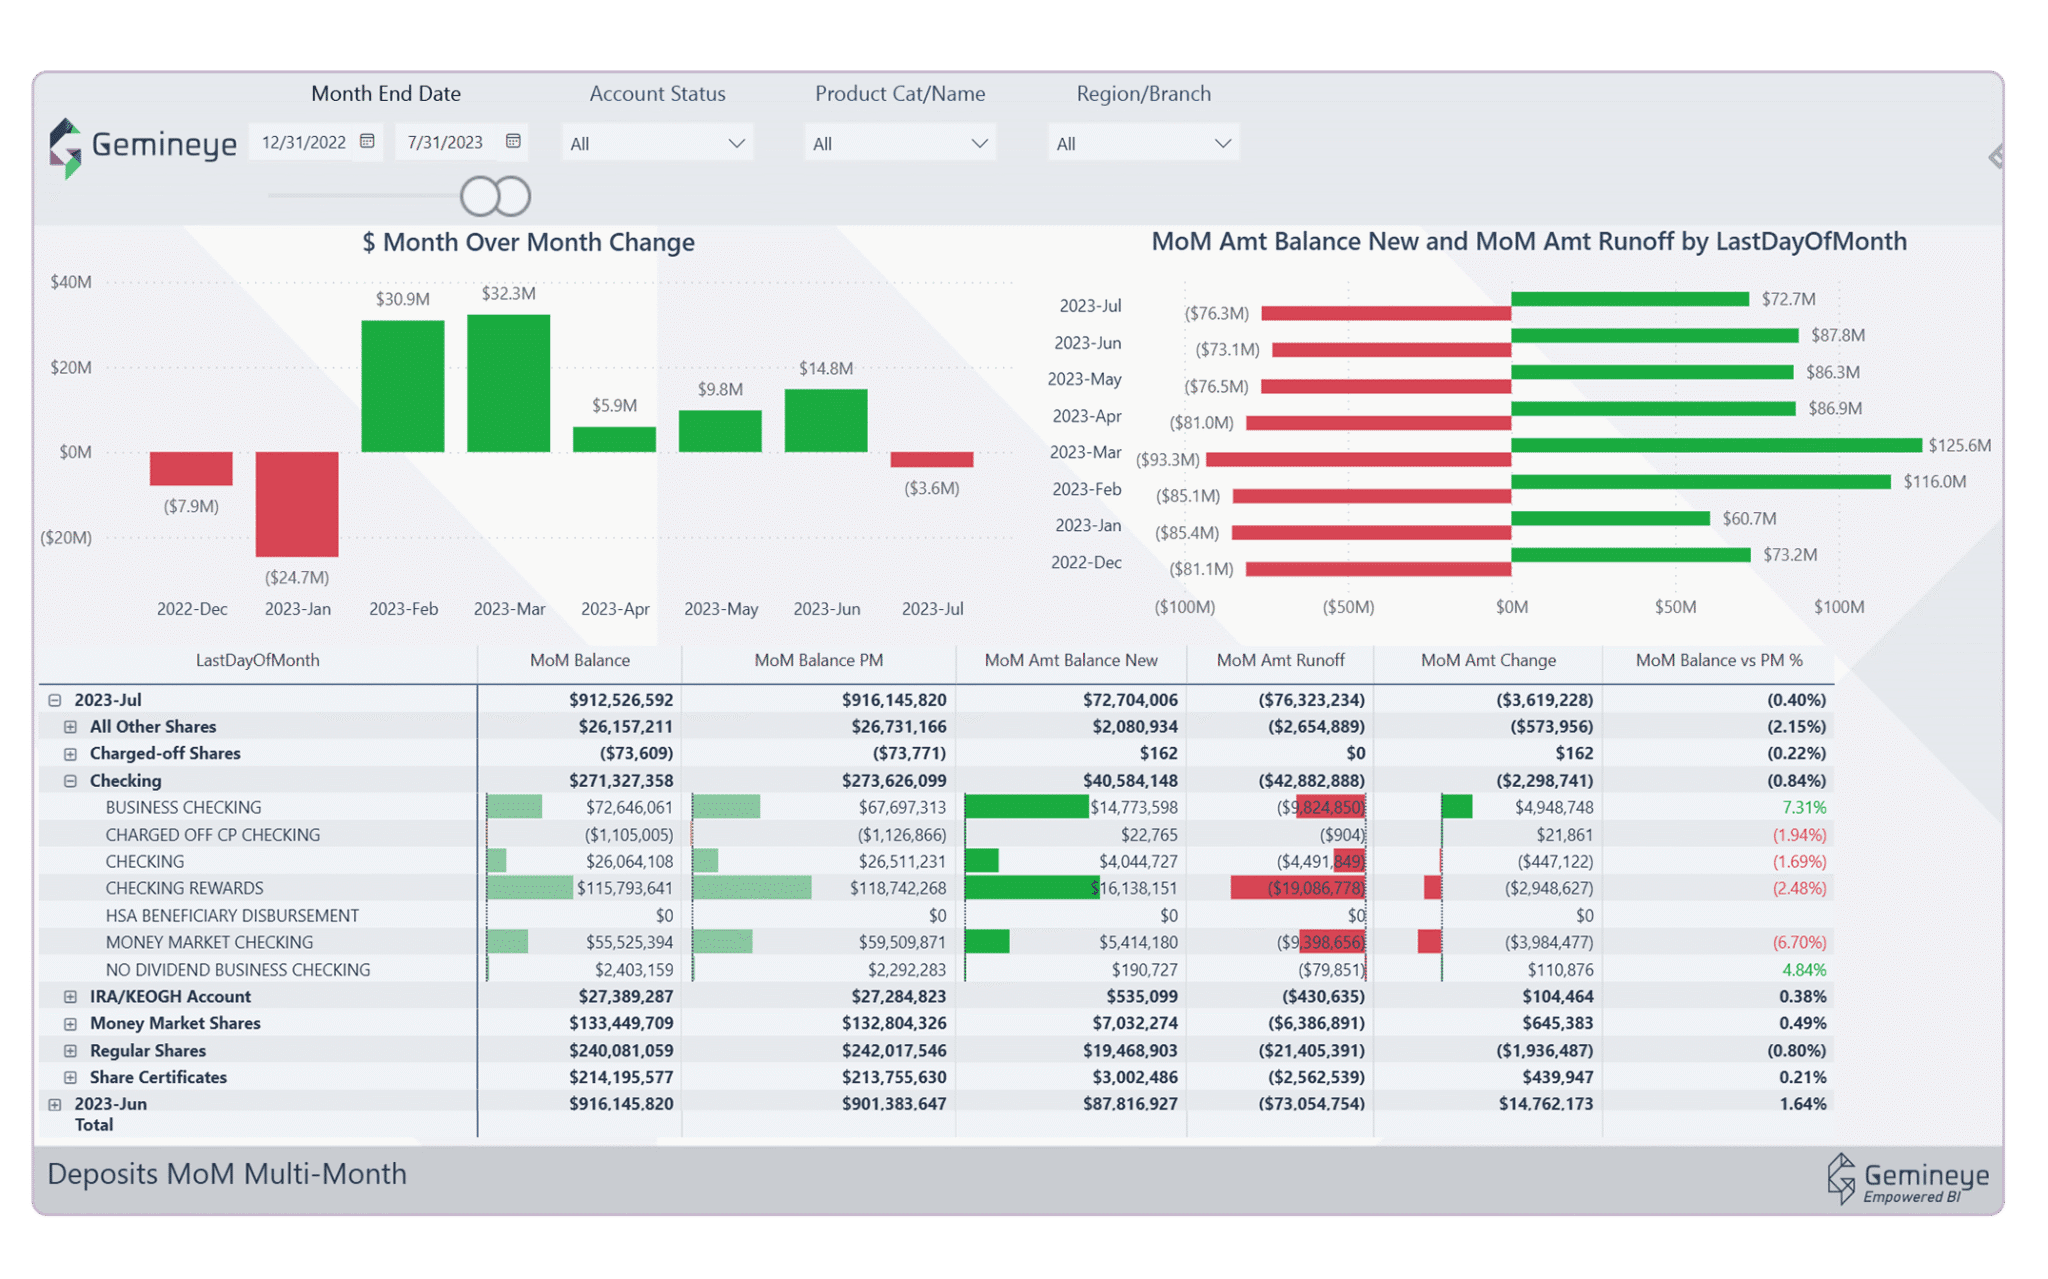
Deep industry expertise

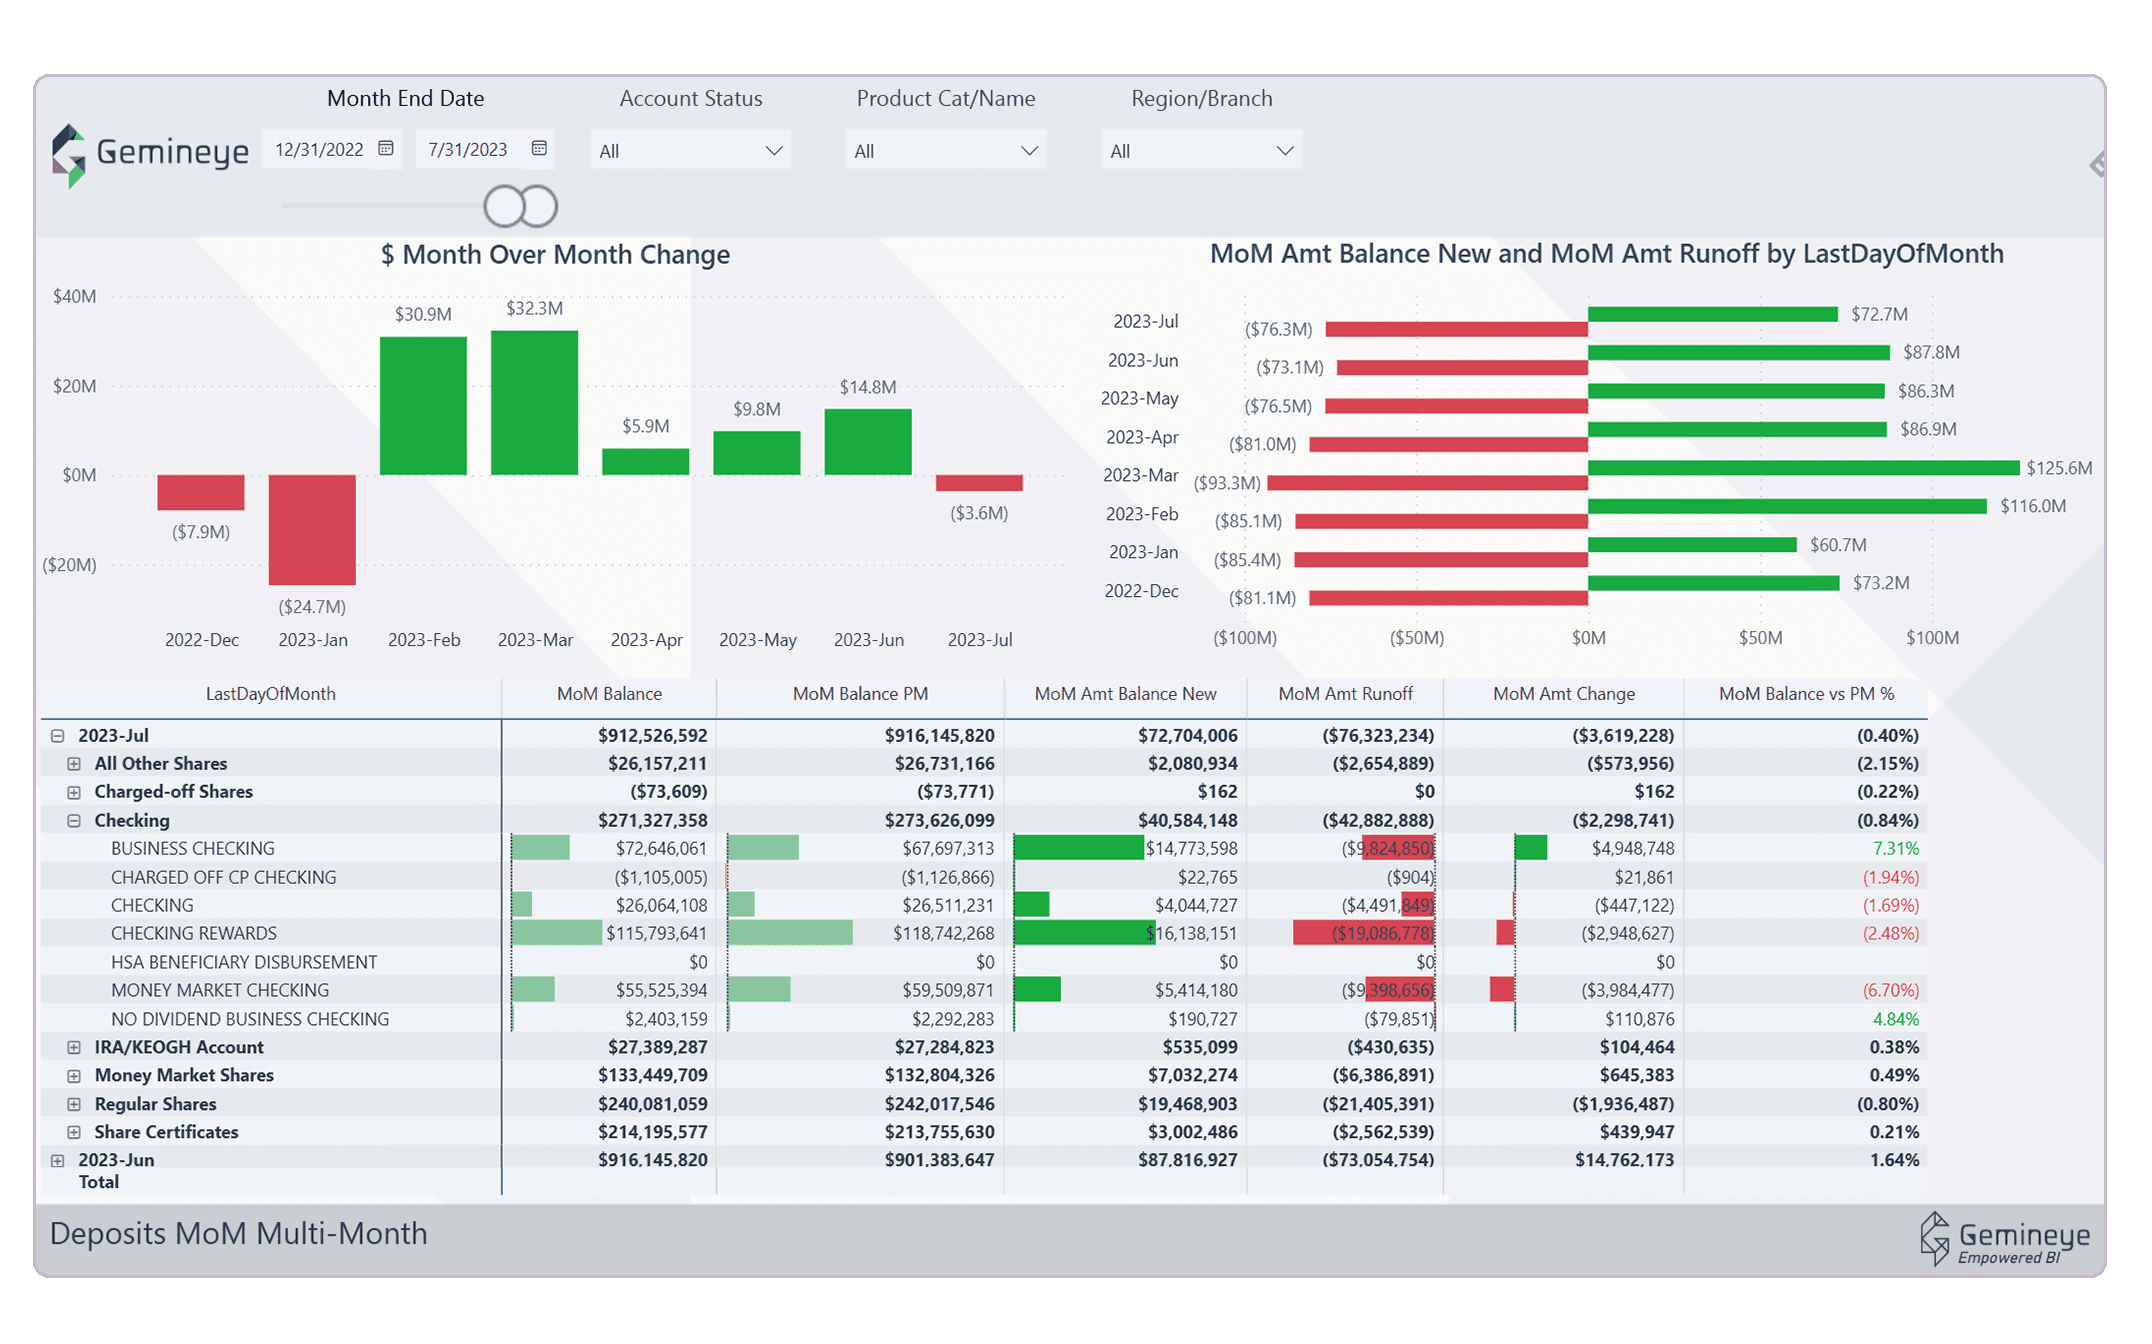
Developed by data engineering experts with decades of experience in credit union finance, both within large and small organizations. Trust that the Gemineye Data Lakehouse financial capabilities are specific to your team’s needs, because we know what it’s like to be in your shoes.
Gemineye data lakehouse month over month balances vs runoffs

Deep industry expertise

Developed by data engineering experts with decades of experience in credit union finance, both within large and small organizations. Trust that the Gemineye Data Lakehouse financial capabilities are specific to your team’s needs, because we know what it’s like to be in your shoes.
Gemineye data lakehouse month over month balances vs runoffs

Hear from Our Clients

Embracing excellence in data analytics and visualizations, our partnership with Gemineye has been a catalyst for innovation. Their solutions empower us to transform raw data into actionable insights, driving strategic decision-making and fostering a culture of success.
Karl Pagel-Finance
Karl Pagel
Chief Financial Officer
4Front CU
Purple quote icon
Purple quote icon
Showing Slide 1 of 2

Over 200 reports and visualizations

Finance teams will be hard pressed to request a financial report that doesn’t already exist within the Gemineye Data Lakehouse. Hundreds of reports and visualizations means there really is something for everyone, no matter how unique your ask.
Gemineye data lakehouse deposit segments

Over 200 reports and visualizations

Finance teams will be hard pressed to request a financial report that doesn’t already exist within the Gemineye Data Lakehouse. Hundreds of reports and visualizations means there really is something for everyone, no matter how unique your ask.
Gemineye data lakehouse deposit segments

Advanced machine learning and AI insights

Don’t setting for second best. Your finance team can use the same AI tools that Fortune 500 companies use, providing cutting-edge insights and dashboards.
Gemineye Data Lakehouse screenshot Product Category

Advanced machine learning and AI insights

Don’t setting for second best. Your finance team can use the same AI tools that Fortune 500 companies use, providing cutting-edge insights and dashboards.
Gemineye Data Lakehouse screenshot Product Category

Deep industry expertise

Developed by data engineering experts with decades of experience in credit union finance, both within large and small organizations. Trust that the Gemineye Data Lakehouse financial capabilities are specific to your team’s needs, because we know what it’s like to be in your shoes.
Gemineye data lakehouse month over month balances vs runoffs

Deep industry expertise

Developed by data engineering experts with decades of experience in credit union finance, both within large and small organizations. Trust that the Gemineye Data Lakehouse financial capabilities are specific to your team’s needs, because we know what it’s like to be in your shoes.
Gemineye data lakehouse month over month balances vs runoffs

75 integrations and counting

We currently support over 75 integrations – even the ones that other data analytics providers won’t touch. Our integrations incorporate leading credit union and bank solutions, like consumer loan and mortgage originations, digital banking, CRM / MRM, third-party data vendors, and more.

Gemineye integrations infographic

News and Resources

Ann Ditlow and bento box
Ann Ditlow: Data Analyst at 4Front CU

Welcome to our very first edition of “A Day in the Life of a Data Analyst,” featuring the equally talented and down-to-earth Ann Ditlow, Data Analyst at 4Front CU. Ann ...

gemineye quorum anniversary
Gemineye and Quorum Federal Credit Union Celebrate Five-year Anniversary

The team at Gemineye is excited to announce their five-year anniversary with Quorum Federal Credit Union, a $1.1B organization headquartered in Purchase, NY. Quorum is an entirely-online credit union with ...

gemineye logo and databricks logo with confetti
Gemineye Announces Partnership with Databricks

  Gemineye (formerly The Knowlton Group) has partnered with Databricks, the world’s leading data and AI company. Gemineye’s innovative data analytics architecture, called the Gemineye Data Lakehouse, is run entirely ...

Showing Slide 1 of 4
mint green triangle
What to Do When Your Data Outgrows Excel

What to Do When Your Data Outgrows Excel

Microsoft Excel is where almost every financial institution’s data work begins. It is familiar, flexible, and already on every desktop. For years, it does the job. The monthly board report...
READ NOW
Showing Slide 1 of 2

Finance FAQs

Lorem ipsum dolor sit amet, consectetur adipiscing elit. Lorem ipsum dolor sit amet, consectetur adipiscing elit?

Maecenas nisl sem, lacinia eget justo semper, suscipit tincidunt orci. Maecenas nisl sem, lacinia eget justo semper, suscipit tincidunt orci.

Lorem ipsum dolor sit amet, consectetur adipiscing elit.Lorem ipsum dolor sit amet, consectetur adipiscing elit. Lorem ipsum dolor sit amet, consectetur adipiscing elit.

How Can Finance Help Your Team?

Level up your accounting game with common-sense capabilities

A practical and powerful data platform built for modern FIs

Know what your customers want today, and tomorrow

Showing Slide 1 of 4
mint green triangle
mint green triangle

News and Resources

The 2026 AI Sentiment Report

Examining the Correlation Between AI Usage and AI Sentiment in Community Financial Institutions In May and June of 2026, Gemineye conducted primary source research on AI, with the goal of examining the correlation between AI usage and AI sentiment among credit unions and community banks. 30 credit union and community bank employees from almost every business unit were surveyed, whose responses were contrasted with AI research from global leaders Gartner and Qualtrics. The results were eye-opening. A disconnect between the executive push for AI and the organizational capability to do so became clear. And your overall feelings on AI were quite surprising. What You’ll Learn from This Report How financial institutions are currently using AI The disconnect between the executive push for AI and the organizational capability to do so How community FI employees like you feel about AI in Q2 2026 High risk vs low risk AI models Why This Guide Matters for Credit Unions and Community Banks This report will help you understand where your financial institution sits within AI usage and sentiment as compared to your peers, including fascinating results from many departments.

semantic models for credit unions

[Video]: Semantic Models 101 for Community FIs

Let’s talk semantic models for community financial institutions. There’s a lot of misconceptions about them. In this video, we discuss the basics of semantic models, break down myths, and share the facts on what you need to know to make an informed analytics decision for your team without getting persuaded by chatter. Exploring Common Semantic Model Questions Fielded from Credit Unions and Community Banks Gemineye’s COO Matt Jefferson and Director of Business Development Maggie Chopp answer: Whether centralized analytics teams are better than departmental analysts Why unified semantic models ensure consistency If there should ever be a cap on how many fields your semantic model should have Why the misconception of limiting number of fields is holding back your analytics potential How credit unions are successfully integrating data from multiple sources without complexity  Full Transcript Alicia Disantis: Are centralized analytics teams better than departmental analysts? And Matt I will ask you that question. Matt Jefferson: I think centralized analytics teams there, they’re great for consistency and governance. Department analysts are great for kind of speed and the business contacts. I think the real win, no matter what you do in an organization, is when you really have them working with the same semantic model, the same governance principles. You know, I think at some level, you always end up with some level of decentralized, analytics. Maggie Chopp: We’ve seen a couple kind of creative configurations this year, and there’s nothing saying that they can’t work. Well, again, given the, the base semantic model like Matt mentioned, that’s kind of the key to making it all flow. But we have a number of credit unions we’ve talked to this year who have very interesting designs that work for their teams, depending on who rolls up to who. But it works nicely again, with the base model. We have a credit union that as an example that brought in data from their collections platform. A lot of that would never, ever hit the core. But it brought them a lot of value when it came to their repossessions. They ended up making a lot more money knowing which of their resellers were getting them the most margin. And again, that’s not something you’re going to find in a core provider. You’d really need a data warehouse to assess something like that. Alicia Disantis: Should there ever be a cap on how many fields your semantic model should have? Matt Jefferson: No, there should be an artificial cap. Right? Business questions evolve. You know, I always say that every financial institution is like a fingerprint, right? You know, it’s a financial institution, but it is a little bit different. Right? And the right solution, the technology solution, everything makes it very easy to adapt to your your business needs, right, to add the things you need. Do you really want to wait for someone to say like, hey, all of our clients need that particular data field before you can access it? Maggie Chopp: I’m gonna add a little caveat, which is it’s not always good to bring everything. And we want to, you know, optimize for efficiency. We want it to run quickly. Run well. But just from speaking from experience, the credit you and I worked at and all the credit runs we talked to, everybody needs something else. Like every single day. The models are great. We just need to add one more thing. And one thing that we’ve observed is that, some providers will make it really difficult to do that. You’ll have to go way back in time. There’s, a statement of work to draw up. There’s all this kind of finagling just to get one additional data field, which really, it shouldn’t be that complicated. We have a bring it all approach. And so bringing something like a single data field in is it is easy and it should be easy. And if it’s ever not, you should reassess how you’re doing it. And on top of that you know, the concept of even having placeholder fields is somewhat meaningful. We found pretty regularly talking to credit unions. They might all have a different definition of something. But if we keep placeholders in the code for different persona types or different segmentations that are credit unions already use, we don’t even have to go about adding a field, so to speak. We’re just using that credit unions logic. So no, we should never be limiting how many fields should be in a semantic model. Want More Data Analytics best practices? Check out our Data Teams page.

Why Your Reporting Is Only as Good as Your Integration Layer

Why Your Reporting Is Only as Good as Your Integration Layer

Every credit union and community bank wants better reporting. Clearer dashboards, more reliable financial analytics, numbers leadership can act on without second-guessing. So institutions invest in reporting tools and dashboard platforms, expecting that better presentation will produce better insight. Often, it does not, and the reason is almost always the same: the problem was never the reporting layer. It was the data feeding it. A dashboard is only as accurate as the data behind it. A financial report is only as trustworthy as the systems it pulls from. When the underlying data is fragmented, inconsistent, or assembled by hand from sources that do not agree with each other, no reporting tool can fix that. The integration layer, the part of the stack that connects and reconciles your data, quietly determines the quality of everything built on top of it. Why Better Dashboards Do Not Fix Bad Data It is tempting to treat reporting problems as presentation problems. If the numbers are confusing or untrustworthy, the thinking goes, a better dashboard will help. But a dashboard does not create accuracy. It displays whatever it is given. If two source systems disagree on what counts as an active member, the dashboard will faithfully display a number that is wrong, just more attractively. McKinsey’s data teams have described this exact failure mode at financial institutions: leadership ends up debating the accuracy of the data instead of acting on the insights. When that happens, the reporting tool is not the problem. The data foundation is. This is why institutions that invest in executive dashboards or financial analytics without first addressing their integration layer are often disappointed. They have improved the window without fixing the view. The reporting looks more sophisticated, but the underlying trust problem remains, because the data still comes from disconnected systems that were never reconciled. What the Integration Layer Actually Does for Reporting The integration layer is the part of a data platform that pulls information from every source (the core system, loan origination, digital banking, the CRM, third-party vendors) and brings it together into a single, consistent foundation. It harmonizes definitions so a term means the same thing everywhere. It reconciles differences so the numbers agree. And it keeps the data current so reports reflect reality rather than a snapshot from three weeks ago. When this layer is working, reporting becomes trustworthy almost as a byproduct. A dashboard pulls from one reconciled source, so the numbers are consistent no matter who views them. A financial report reflects the same customer and account definitions as every other report, so the figures reconcile across departments. The reporting tools finally deliver on their promise, because they are working from data that can actually support them. How Both Data Teams and Executives Experience This Problem The integration gap shows up differently depending on where you sit, but it is the same root cause. For the data team, it appears as endless manual reconciliation: pulling exports, matching records, explaining why two reports disagree, and rebuilding the same logic every reporting cycle. The team knows the reporting is fragile because they are the ones holding it together by hand. For executives, it appears as a quieter erosion of confidence. The numbers in one report do not match another. A figure presented in a board meeting gets challenged and cannot be quickly defended. Over time, leadership learns to treat every number with a degree of skepticism, which slows decisions and undermines the entire purpose of having analytics in the first place. Both experiences trace back to the same place: data that was never properly connected before it reached the report. Why Data Lineage and Consistent Definitions Matter Two capabilities separate an integration layer that produces trustworthy reporting from one that does not. The first is consistent, governed definitions: the assurance that a field means the same thing everywhere it appears, so reports reconcile by design rather than by manual effort. The second is data lineage, the ability to trace exactly how a number moved from its source system through the platform and into a report. Lineage matters because trust requires verification. When an executive questions a figure, the data team should be able to show precisely where it came from and how it was calculated, rather than launching an investigation. When that traceability exists, confidence in reporting is durable, because it can be confirmed rather than merely asserted. Without it, every disputed number becomes a research project, and trust never fully takes hold. How Gemineye Builds Reporting You Can Trust Gemineye’s Data Integrations solution exists to give credit union and community bank reporting a foundation it can rely on. With more than 75 pre-built integrations connecting the core system, loan and mortgage origination, digital banking, CRM, and third-party data vendors, Gemineye brings every source into one reconciled environment. Consistent, customizable definitions mean a number means the same thing across every report, and end-to-end data lineage with a transparent data dictionary lets your team trace exactly how each field moves from source to dashboard. The result is that the dashboards and financial analytics your teams depend on are finally built on data they can trust. If your reporting is not as reliable as it should be, the place to start is the integration layer underneath it. See how Gemineye’s Data Integrations solution gives your reporting a foundation worth building on.

Showing Slide 1 of 4

Ready to finally have control over your data analytics experience?

We offer complimentary consultations – never pushy, always honest.