Ann Ditlow: Data Analyst at 4Front CU
Welcome to our very first edition of “A Day in the Life of a Data Analyst,” featuring the equally talented and down-to-earth Ann Ditlow, Data Analyst at 4Front CU. Ann ...






Welcome to our very first edition of “A Day in the Life of a Data Analyst,” featuring the equally talented and down-to-earth Ann Ditlow, Data Analyst at 4Front CU. Ann ...
The team at Gemineye is excited to announce their five-year anniversary with Quorum Federal Credit Union, a $1.1B organization headquartered in Purchase, NY. Quorum is an entirely-online credit union with ...
Gemineye (formerly The Knowlton Group) has partnered with Databricks, the world’s leading data and AI company. Gemineye’s innovative data analytics architecture, called the Gemineye Data Lakehouse, is run entirely ...

The Gemineye Team is Attending the Nevada and California Credit Union League 2026 REACH Conference! We’re excited to be attending the REACH Conference this year on November 2nd to 5th 2026, hosted in gorgeous Palm Springs, California. Stop by our booth to learn about the breakthrough tools we’ve been developing in ’26, including our brand new contextual AI assistant, called the Gemineye Genie, and our profitability modeling tools. Have questions about the state of analytics and AI in the credit union industry? Visit our booth to have a conversation about your CU’s data journey with Maggie Chopp, Director of Business Development at Gemineye. Explore New Products and Services Learn more about the capabilities of our new lakehouse version as well as Gemineye Genie, different from anything on the market. And if you’d like to see our AI assistant in action (who wouldn’t?), we can show you how powerful and easy it is to use. Book a 1:1 Consultation If you’d like to set up a 1:1 time to talk with the Gemineye team about our business use capabilities or take a technical deep-dive, you can schedule time with us here. Our booth team are experts in data and you’ll be able to talk well beyond the technical depth of the standard booth rep level. 👉 Click here to schedule a 1:1 session with us. Snag Our Legendary Swag Our swag has developed something of a reputation over the past couple years. Stop by our booth to browse our variety of swag, including custom socks, pennants, thermal mugs, and more! Learn More About Gemineye’ Analytics Suite Before You Attend Interested in learning more about Gemineye’s Data Lakehouse and analytics tools before the event? Browse the solutions we provide and teams we help!
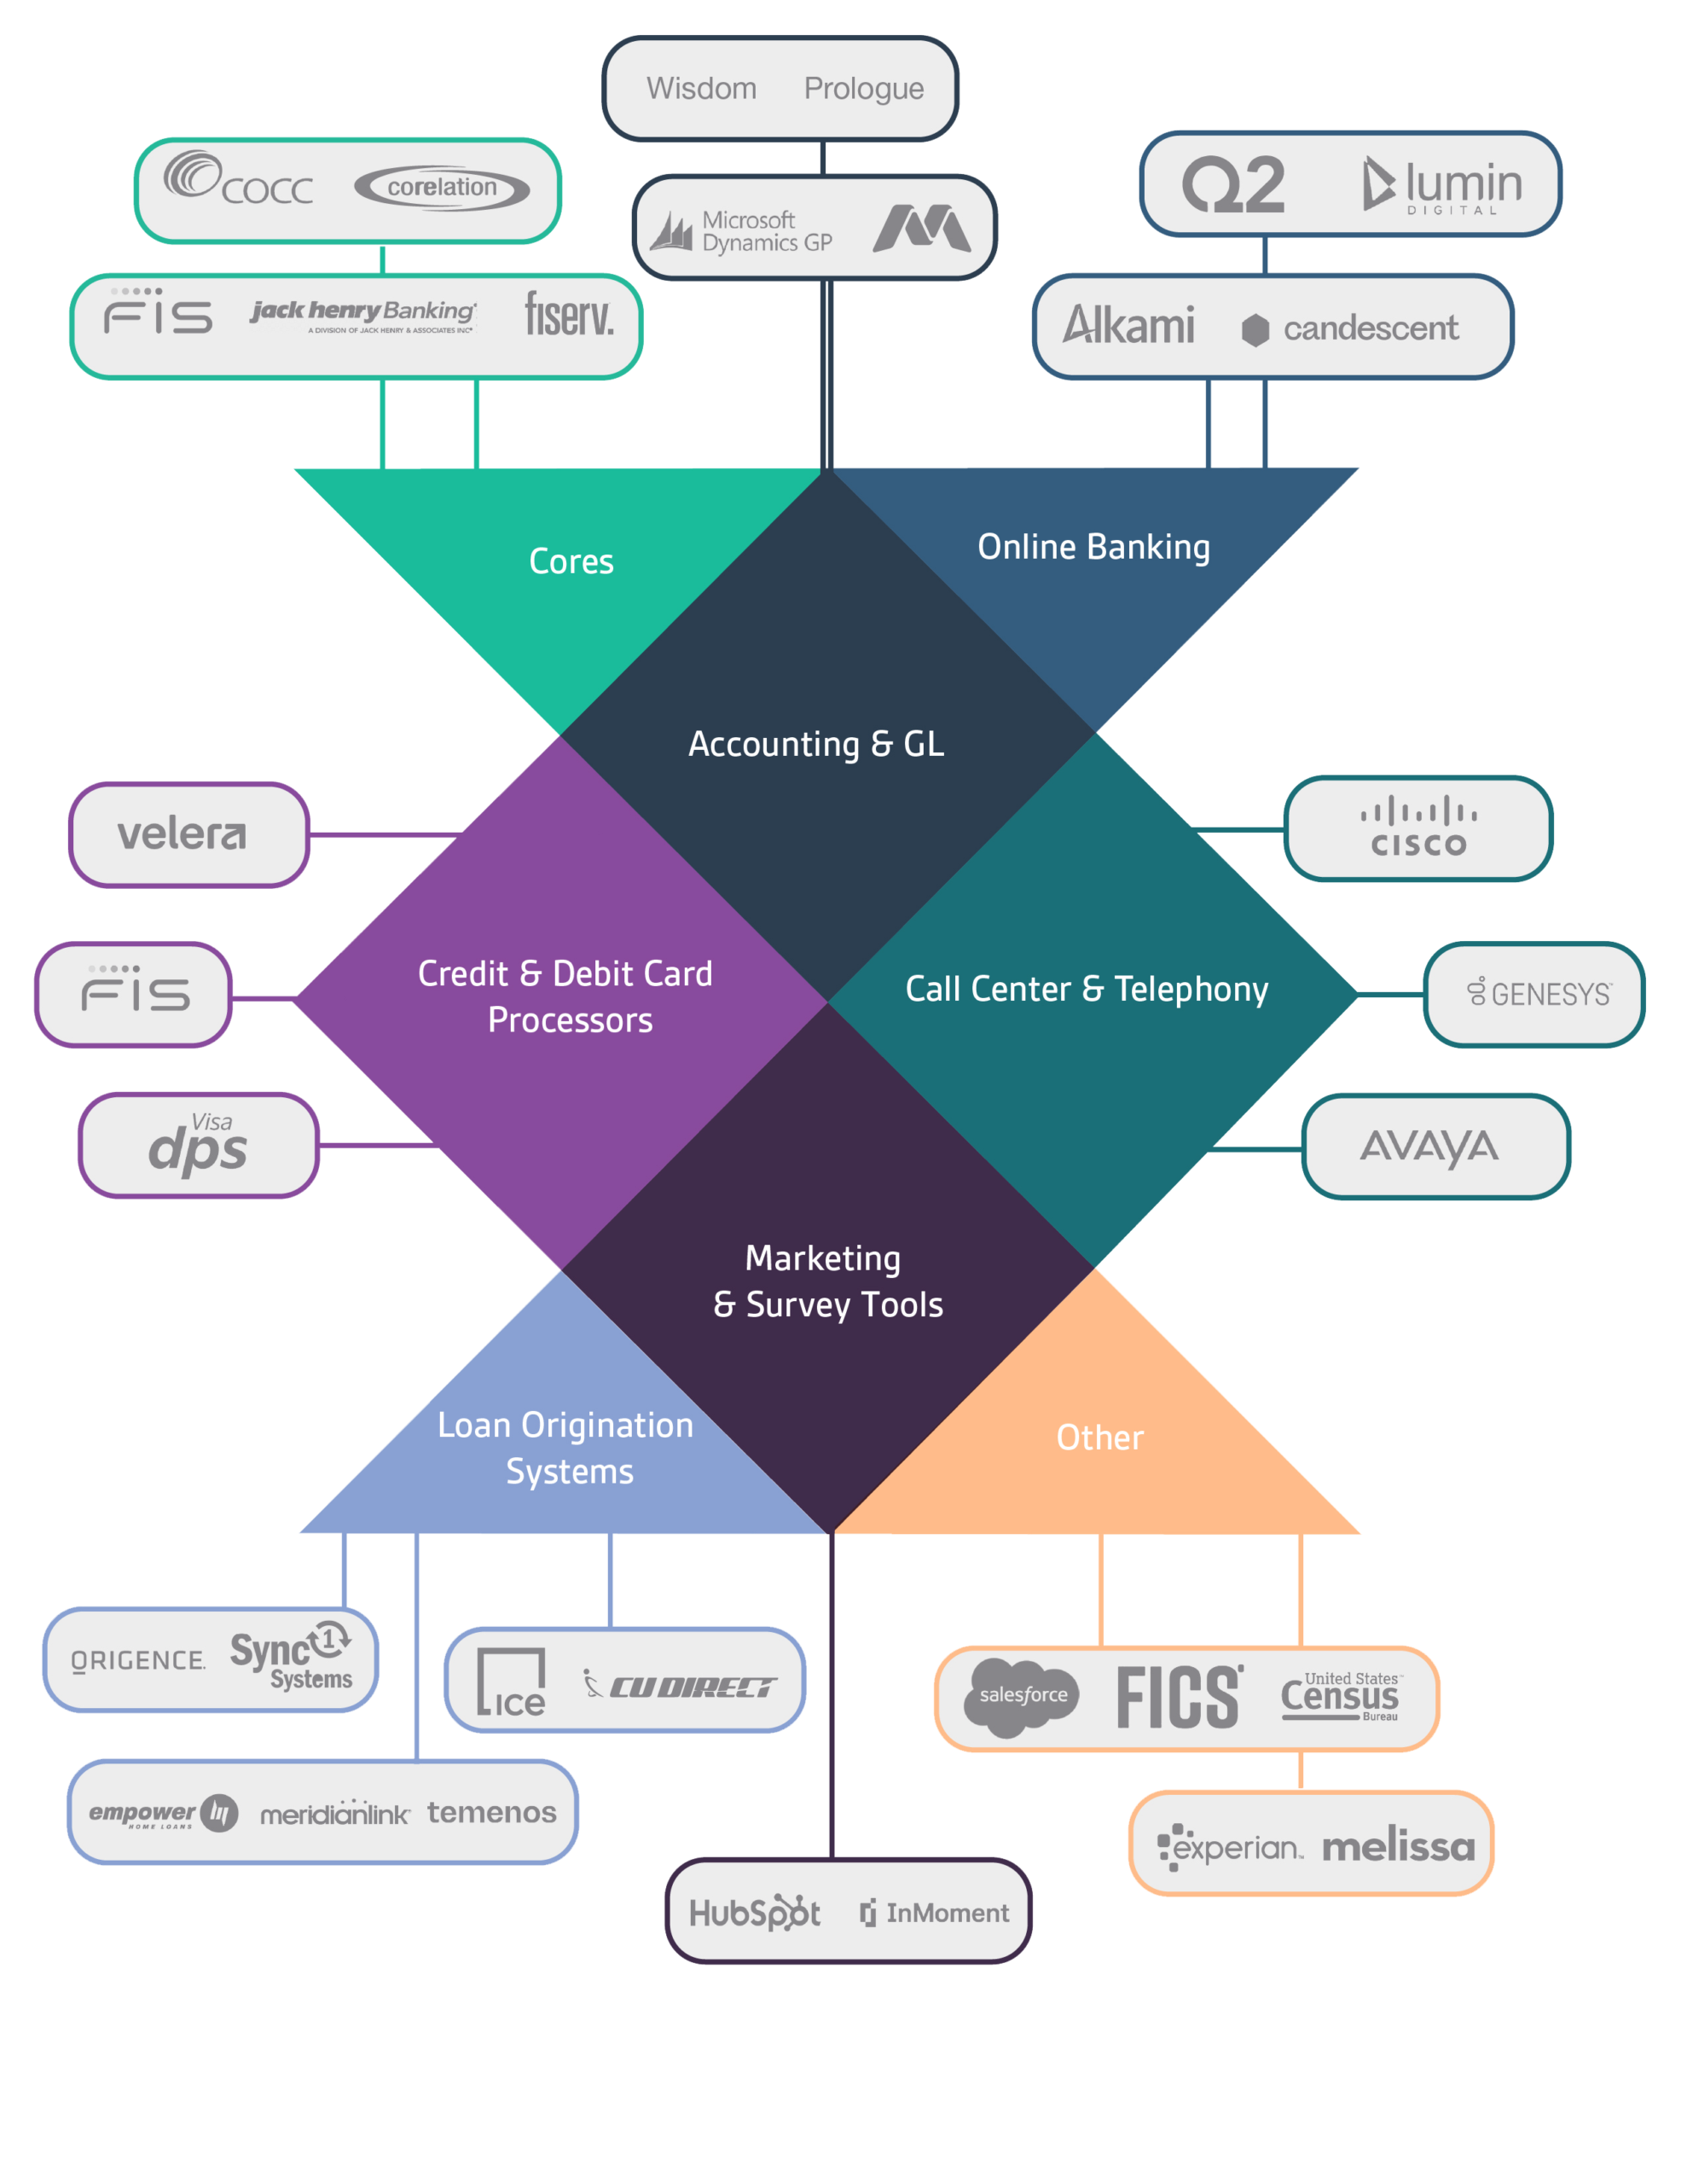
Data integration is an easy thing for a CFO to deprioritize. It sounds technical, it lives in the domain of the data team, and unlike a new branch or a marketing campaign, its costs never appear as a line item anyone approved. That is exactly what makes poor integration so expensive. It is a cost the institution pays continuously, in ways that never surface on the financial statements until someone connects them to the numbers a CFO already watches. For a data or analytics leader trying to make the case for investment, the challenge is translation: turning a problem you experience daily into terms that register with the person who controls the budget. This is what a CFO needs to understand about what poor data integration is actually costing the institution, expressed in the language of the finance office rather than the data team. Why Poor Integration Is a Cost the Financial Statements Hide The reason these costs go unnoticed is that they are distributed. They do not sit in one budget line. They are spread across staff hours, delayed decisions, and errors that get quietly corrected, none of which is labeled as a cost of poor integration. Wolters Kluwer describes the underlying mechanism plainly, noting that the typical institution moves data from one system to the next in a linear fashion, which makes it slow and error prone, with the process bogged down by backfilling, checking, and reconciling work that has already been done. That reconciliation labor is a real, recurring expense. It simply never gets named as one. For a CFO, the useful reframe is that the absence of a line item does not mean the absence of a cost. The institution is already paying for poor integration every month. The only question is whether that spending is visible enough to manage. Right now, for most institutions, it is not. How Poor Integration Wastes Your Most Expensive Employees’ Time The most quantifiable cost is labor. When systems do not connect, skilled staff spend hours every week manually pulling data, reconciling figures that do not match, and rebuilding the same reports from scratch. This is work that would not exist if the data were integrated, and it is being done by some of the institution’s more expensive employees, the analysts and finance staff who should be interpreting data rather than assembling it. A CFO can grasp this immediately when it is framed as capacity. Every hour spent on manual data assembly is an hour not spent on analysis that could improve lending, retention, or efficiency. The institution is paying full salary for high-value people to do low-value reconciliation work, indefinitely, because the systems underneath them were never connected. That is a payroll cost hiding inside a data problem. How Disconnected Data Undermines Every Decision Leadership Makes Beyond labor, poor integration carries a decision cost that is harder to quantify but often larger. When data comes from disconnected systems that do not agree, leadership cannot fully trust any single number. Meetings get consumed by debating whose figures are correct rather than deciding what to do. Decisions get delayed while someone goes to reconcile the discrepancy, and some decisions get made on incomplete or inconsistent information because the reconciled version was not available in time. For a CFO, this is the cost that should be most concerning, because it undermines the entire purpose of having data at all. An institution invests in reporting and analytics to make better decisions, but poor integration quietly degrades the quality of the very decisions that investment was meant to improve. The money spent on data tools delivers a fraction of its potential value when the data feeding them cannot be trusted. Why Poor Data Integration Gets More Expensive as Your Institution Grows The final point a CFO needs to understand is that this is not a static cost. It compounds. Every new system the institution adopts, whether a new digital banking platform, a new origination tool, or a new service, adds another disconnected source that must be manually bridged to everything else. Each addition increases the reconciliation burden and the number of places data can disagree. This means that doing nothing is not holding steady. It is choosing a cost that rises every year as the institution grows and adds technology. A CFO evaluating whether to invest in integration should weigh it not against this year’s cost of the status quo, but against the larger and growing cost of continuing to operate without it. Framed that way, integration stops looking like an expense and starts looking like the avoidance of an expanding liability. Bring the Hidden Cost Into View With Gemineye The strongest way to make the cost of poor integration visible is to eliminate it, and to do that with an approach built for how credit unions and community banks actually operate. Gemineye’s Data Integrations solution connects the core system, loan and mortgage origination, digital banking, CRM, and third-party data vendors into one reconciled environment through more than 75 pre-built integrations. That removes the manual reconciliation labor, restores trust in the numbers, and stops the cost from compounding as new systems are added. When your CFO can see what poor integration has been costing, the case for fixing it makes itself. See how Gemineye turns a hidden cost into a solved problem.
For most credit unions and community banks, the rhythm of management is monthly. The books close, the reports are assembled, the numbers are reviewed, and leadership makes decisions based on what happened last month. This cycle is so deeply ingrained that it can feel like simply how banking works. But it carries a hidden cost: by the time the monthly report is in hand, the institution is managing a picture of the past rather than the business in front of it. Moving to on-demand operational visibility is not about producing the same reports faster. It is a change in how an institution operates, from reacting to a monthly summary to managing the business as it actually unfolds. Understanding what that shift looks like, and what it makes possible, is the first step toward deciding whether your institution is ready to make it. What the Monthly Reporting Cycle Actually Costs The monthly cycle feels thorough and disciplined, which is why it persists. But its cost is measured in the gap between when something happens and when leadership can act on it. If a trend begins early in the month, no one sees it until the books close weeks later, and by then a full month of opportunity to respond has already passed. The institution is perpetually acting on information that is, on average, several weeks old. That lag has real consequences. A staffing imbalance goes uncorrected for a month. A shift in product uptake is not noticed until the quarter’s numbers force the question. A branch drifting off track keeps drifting, because the signal that would have prompted a conversation is buried in a report that has not been produced yet. None of these are dramatic failures. They are the quiet, compounding cost of always being a step behind, and most institutions have simply accepted it as normal. What Changes When Credit Union Leaders See Data On Demand On-demand visibility collapses the gap between event and action. Instead of waiting for the monthly close to learn how the institution is performing, leaders can see the current state of the business whenever they need it. A question that used to require a request and a wait becomes something a leader answers on the spot. The management rhythm shifts from monthly review to continuous awareness. This changes the nature of leadership decisions. When a branch’s numbers start to move, the conversation happens this week, not next month. When a service bottleneck appears, it can be addressed while it is still small. Leaders stop reacting to a summary of what already happened and start managing with a current view of what is happening now. The monthly report does not disappear, but it stops being the first time anyone learns what is going on. It becomes a confirmation of decisions already being made with current information. Why On-Demand Visibility Is a Competitive Advantage Speed of insight is not just an internal convenience. It is a genuine advantage against slower institutions. A credit union or community bank that can spot an opportunity or a problem weeks before a competitor has a real edge, because it can act while the window is still open. In a market where larger institutions have more resources but move more slowly, the ability to see and respond quickly is one of the few advantages a nimble institution can actually own. This matters especially as expectations rise. Members and customers increasingly expect responsiveness, and the institutions that can adjust staffing, service, and offerings based on current reality will consistently serve them better than those working from last month’s snapshot. On-demand visibility turns organizational agility from an aspiration into an operational capability. What It Takes to Reach On-Demand Reporting at a Financial Institution The barrier to on-demand visibility is rarely a lack of desire. It is infrastructure. The monthly cycle exists in large part because assembling a complete picture requires pulling data from many separate systems and reconciling it by hand, which can only realistically be done periodically. As long as that assembly is manual, monthly is often the fastest cadence an institution can sustain. On-demand visibility becomes possible when the underlying data is connected and flows automatically. When the systems behind the institution feed a single, current view without manual assembly, the reporting cadence is no longer limited by how fast people can compile spreadsheets. The information is simply there, current, whenever it is needed. This is why moving past the monthly cycle is fundamentally a data infrastructure decision, not a reporting-process decision. Turn Monthly Reporting Into On-Demand Visibility With Gemineye Moving from monthly reporting to on-demand visibility depends on connecting the systems behind your institution so the data flows on its own. Gemineye’s Operations solution is built to make that shift, delivering automated daily reporting across branch performance, staffing, product penetration, and onboarding, so leaders manage from the present rather than the previous month. If your institution is still waiting on the monthly close to understand how the business is running, see how Gemineye helps credit unions and community banks move to a current view of their operations.