In this edition of “A Day in the Life of a Data Analyst,” we talk with Mike Riley, Data Analyst at The Cooperative Bank of Cape Cod. Mike has been working in IT for almost 40 years, starting his career in the Marine Corp. As someone with Aphantasia, a phenomenon in which one is unable to visualize imagery (lack of a mind’s eye), he provides a unique and fascinating perspective on data analytics and reporting.
The Cooperative Bank of Cape Cod is a $1.4B organization with nine branches around Cape Cod, MA. Interviewed by Alicia Disantis, Brand Strategist at Gemineye, Mike talks with us about his love of finding the real picture behind data, being an extrovert, and championing consistency.

How Mike Riley Began his Journey in Data Analytics
Alicia Disantis: What got you interested in data analytics and data analytics within financial services?
Mike Riley: I’ve been at the Coop for 16 years, but this wasn’t my first go around with data. My data start happened way back in 1986. I was an aviation electrician in the Marine Corps. They automated our shop. We went from a paper-based system to a computerized system. That was my start with computers and data.
I took a KUDER test, kind of like a self-assessment that matches your attributes with a job. It’s one of those wacky tests that asks questions like: “On a rainy day you would rather sleep, read a novel, watch TV?”. And it came back saying your number one occupation should be “computer programmer” and your number two should be “bookstore owner.”
At that point I changed jobs and switched over to computer programmer and I started a career in programming. The Marine Corp taught me COBOL. I worked on some major systems. After a twenty-year career I retired. My first civilian job was database-driven web design. It was difficult because the web is stateless and that was a big takeaway for me. There were no more global variables. Every web page is stand alone and if you want to go from web page 1 to web page 2, you need to have enough information to connect the two together.
Ten years and three-hundred websites later, I started working at the bank. I managed data, nightly processes, and the reporting systems. When I started, we were in-house. We ran, maintained, and updated all the core programs. At the end of the day when the banks closed their doors, we had to process all the transactions. It would start around 6:30 PM and run until 10 or 11 o’clock. There were even some days where the nightly update had not finished before the doors opened the next day.
I like problem solving. I like logic. I like taking complex data concepts and explaining it to the average person. For example, if you ask me, “Mike, what’s a database?”
And I start telling you, “Well, it’s tables, views, fields, and triggers” you are going to be confused. But if I say, “It’s a place where you can put your data into little cubbyholes.” Boom.
Is that what you find most rewarding about what you do?
Mike: Yeah, I think so. Trying to explain data and data concepts. Interrogating the data and trying to make sense of it and helping other people make sense of it. I like looking for connections. I am not a banker; I am a programmer. I had to understand what bankers do and the connections between the systems. Every day is a learning process. I’ve been at the Coop for 16 years, and I just last month figured out what the heck a “Now Account” is.
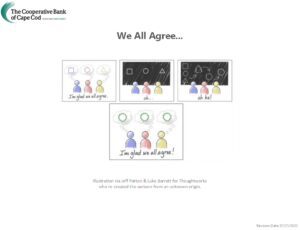
Mike: I am an ENTP according to Myers-Briggs, which means I’m an extrovert. I enjoy sitting in a room with other people and trying to make sense of stuff. If I were an introvert, that activity would most likely drive me crazy. I’d have to grin and bear being in a room with people. Then, come back to my desk, by myself and just unscramble everything. But no, I like being in the room, and if something smells bad, I say something. Sometimes they don’t like to hear my bluntness. A key piece is this, everybody must agree on the definitions and terms. That is a concept I try to live by.

Another key piece is, “Make everything as simple as possible, but not simpler.” Everybody must agree. I could tell you a story about what happened back in my early Marine Corps data processing days. I was brand new, and the department head was a retired Marine Corps officer. He got all of us into the room and starts talking about how “perception is reality.” I felt like a rock. I didn’t get it. I followed him into his office and said, “I’m not trying to be a jerk, I just don’t understand what you’re talking about.” He said, “Reality could be ‘A’, but if a customer thinks that ‘B’ is the reality, their perception of reality becomes reality. And I was like, “Oh ok, so you got to look at it from a customer’s point of view.”
How do you take that learning and apply it to a modern-day outlook on what you do at the bank?
Mike: You can’t start from: I want result X and then make the data fit result X. Anybody can do that. You can’t just trim off what you don’t like? You must start with the data in its ugly fashion and show what it really looks like. Have the data tell the story all by itself.
And if the data story doesn’t match what you’re expecting, then ask: What caused the data to get like this? And then you must change your behavior or your process. Let the data tell you how you should be changing instead of forcing a result. That doesn’t tell the true story. Don’t manipulate the data, just show the data as it is… however ugly it is. I don’t start with what I want the data to look like. I start with what the data does look like and then have it tell you how your behavior should change to get the output you want or the outcome you’re looking for.
The Cooperative Bank of Cape Cod’s Data Analytics Team
How many folks are in your department and how do people come to you in other departments with requests?
Mike: We’ve got nine people in our department. Two of us are data related. Everybody else manages networks, the computers, and the help desk. I would say I’m the database administrator and I’m also the chief reporting administrator- not the report writer – but I manage the reporting system that everybody uses. They will come to me if they’re trying to figure out how to write a report.
Our data comes from the core provider around 4:00 o’clock in the morning and then it goes into our SQL database, and then we can report off it. We also have data feeds. Data feeds are our way of sending information from us to other vendors, to feed their systems. Which in turn let’s them provide information back to us. My major responsibility is to make sure that the data from the core provider gets into our system on time. There’s a huge timeline that’s really important. I’ve actually mapped it out. It helps tell the story of how our data gets here and where it goes, based off time of day.
Other departments will come to me for requests or when they want to kick ideas around. In fact, Eric, who runs deposit operations, came to me the other day and he says, “I’m looking for this.” I listen to him, and I say, “Well, what you’re asking for is a miracle.”
Alicia: I’m sure he loved that. [Laughing]
Mike: We have a great relationship. He says, “Well, what do you mean by that? I said, “You’re trying to turn rows into columns, and it’s not that simple.” “So how do I make this miracle happen?” he asks. I tell him to put some time on the calendar and we’ll figure out what he is really looking for. We can start small. You get the first pass, the second pass, the third pass, and it takes time.
There are two of us in the bank that know SQL and there’s a couple other guys that might be in 8th grade SQL, one might be in fifth grade SQL, but they’re just not at the level that we’re at.
Speaking of different levels of knowledge, what’s something that you wish you knew about this career before you got into it?
Mike: You don’t have to know everything. Don’t be afraid to ask the hard questions. Get everybody on the same page. Make sure that we all agree on what we’re trying to accomplish and the definitions. Now that we’re with Gemineye, we are going to put our data out there. How do I present the same information from someone else’s point of view? I can’t expect a banker to understand SQL stuff. I try to talk his/her language and then go through the translation myself. I didn’t realize how much communication between different departments was needed just to get a clear picture.
Also, I want you to know that I have Aphantasia. I’ll just describe it to you – I don’t have a mind’s eye. Go through this exercise with me.
Alright, close your eyes and picture your favorite fruit.
Alicia: OK.
Mike: Turn it, turn it around.
Look at it from above.
Look at it from underneath.
Push it as far away from you as you can, so it’s small.
And now bring it back, real up close.
And put it back where it started from.
OK, open your eyes.
Could you see something?
Alicia: Yes, yes.
Mike: OK when I do that, all I see is blackness. It’s just totally dark. I don’t have a mind’s eye. I know what stuff looks like. I can understand what an apple is. I just can’t picture it. I can’t turn it around in my mind. Aphantasia affects 4% of the world’s population, but most people don’t realize that someone else doesn’t have a mind’s eye.
Alicia: I feel like that would inherently make you that much better in communicating reports and visuals because you have no other choice.
Mike: Yes, or I draw them out. Even if it’s just white boarding, “This + this + this divided by that equals.” “It would be group like this and draw a circle around these four.” I can’t do that in my head. I have to do it on paper.
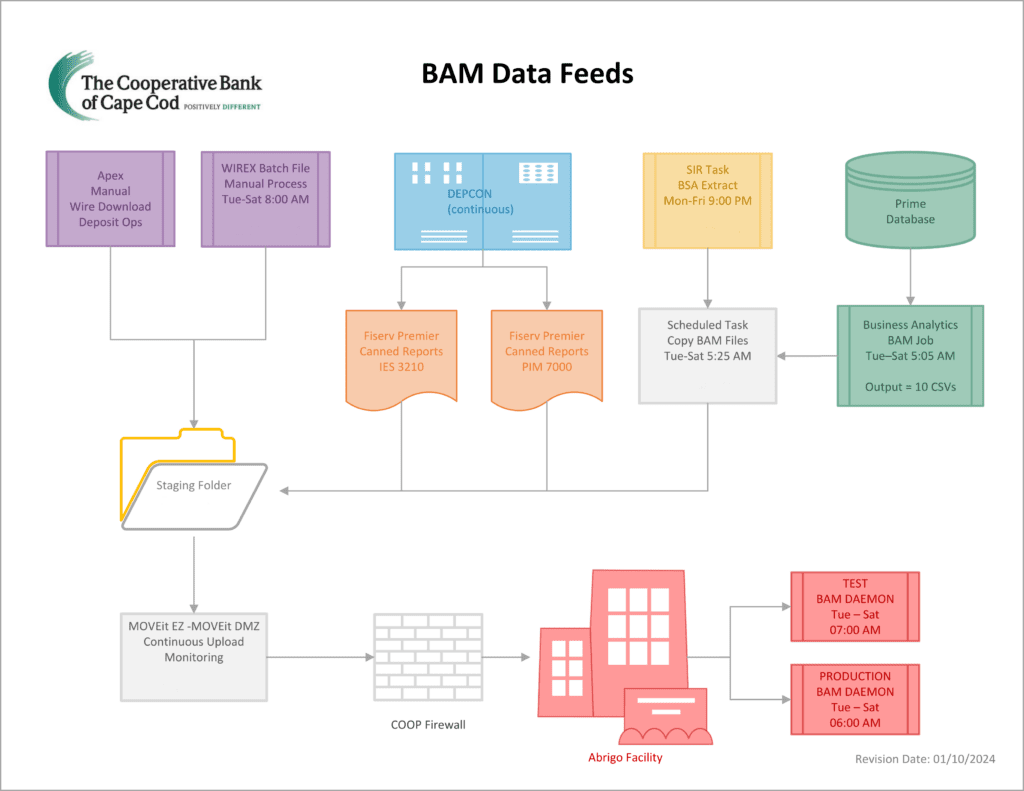
That’s a system we interact with in the morning, and for all of us to be on the same page I put this graphic together.
“Are you having a problem with this piece right here?” and I point to a specific block on the page. “Yes.” Instead of having to talk about it, I can just point and ask what piece is broken.
At night, I don’t replay my whole day over and over again. I just close my eyes. Everything’s black. Off to dreamland.
A Typical Day for a Data Team at a Community Bank
Walk me through a typical day. It sounds like it’s exceedingly time-sensitive based on all the reports that have to come in at certain times.
Mike: For the general “day in the life,” I assume it’s going to be good and everything’s going to work. And unless I hear otherwise, everything is good. I don’t even plug into my work email outside of work, so when I get in at 8:30 or 9:00 o’clock in the morning, everything’s just a surprise. I don’t get pinged early in the morning from one of the guys that comes in at 6:30 as he looks for a specific report that I set up.
He’s the early show, so if I don’t hear from him, everything’s good. Once I make sure that the data from our core provider came in and is good, the next thing is to check the reports. Did any reports that were supposed to run between 5:00 o’clock in the morning and 8:00 o’clock in the morning fail? And if those reports or those data feeds failed, then we have to jump on those and get that information up to date and sent off to the vendors. Otherwise, it’s kind of like “set it and forget it.”
Now it’s 9:00 o’clock in the morning: What requests do people have for data projects? What tasks would I like to accomplish? Anything that’s customer facing that requires data takes the highest priority over anything else.
There are projects I want to work on, like data cleanup, data governance, and data integrity. Little pieces like that are always available to do. Do I have time to focus on this?” What would it take to get this data clean? For example, if we’re doing a digital onboarding system and they need data, I’ll have to sit in the meeting and say, “Well, what do you need? What does it look like? How often do you need it?” Things like that.
I monitor the health of the systems throughout the day. I pick a system that could be tweaked and be more efficient. How can I make that better, more efficient, less hands-on? I put efficiencies in place, where people can self-serve and pull their own reports instead of having to ask me for help.
We don’t have a whole lot of overlap in our processes or team schedule. And I’m thinking if you talk to other banks and credit unions, their IT departments are pretty thin, too.
Are there certain times of day you set aside for more strategic work or more deep dives?
Mike: Yeah, earlier in the day because come three or four o’clock, after problem solving all day, I call it the oatmeal hour. Everything’s turned to mush.
Alicia: Who do you report to?
Mike: Jason Bordun is my supervisor. He’s the IT manager. He’s also a Marine.
Alicia: Is there a time in the week that the whole team meets to strategize, and problem solve?
Mike: We get together twice a week to talk about what’s going on, priorities, responsibilities. We have a pretty safe environment, so we can share our concerns privately. We try to keep the drama low, but IT is always first to be blamed!
I treat fellow employees like they’re my customers. “Sorry to bother you,” they say. You’re not a bother. You’re my customer.
What’s something you could spend all day doing?
Mike: Playing around with SQL and trying to understand how data works. I want to go figure out how all these pieces of data fit together and work.

